This short report is a snapshot compilation of the most recently released federal data collected on the engineering and computing workforce in order to provide a data-driven outlook of the current and projected trends in the workforce.
Highlights of this report include:
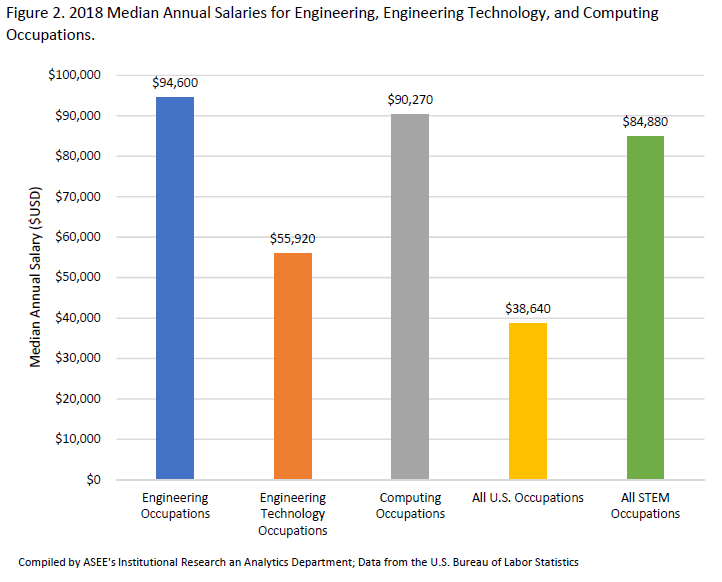
- The median annual salary in 2018 was $94,600 for all engineers, $55,920 for all engineering technicians and technologists, and $90,270 for all computational professionals. Also, the median annual salaries for all occupations within the engineering, engineering technology, and computing were higher than $38,640, the median annual salary for all U.S. occupations.
- Low gender and racial and ethnic diversity in the engineering, engineering technology, and computing occupations continues to be an issue. However, in 2018, the computing workforce had the highest percentage of women at 24% compared to the engineering workforce. The engineering technology occupations had the highest percentage of workers from underrepresented racial and ethnic groups at 21% compared to the engineering and computing workforces.
- The engineering workforce requires highly skilled and trained individuals to meet the needs of the global workforce. However, many of the skills gained through postsecondary engineering programs are transferrable and desired within other areas in the science and technology workforce.
- With the high number of computing jobs in occupations that require a bachelor’s degree and the high median annual salaries for these occupations, there may be less incentive for individuals to work towards higher degrees in computer science.
- Over the next decade, the number of jobs is predicted to increase by 5% within engineering occupations, increase by 2% within engineering technology occupations, and increase by 13% in the computing occupations. For comparison, the total number of jobs in the U.S. workforce is predicted to increase by 5.2%.
Present Engineering and Computing Workforce
According to the United States Bureau of Labor Statistics (BLS), there were approximately 2 million engineers, 700 thousand engineering technicians and technologists, and 4.1 million computational professionals in the U.S. workforce in 2018.
Engineering Workforce
The engineering workforce consists of a series of engineering and engineering technology occupations within the United States, and there is overlap in the education and skills development for these occupations.
Engineering Occupations
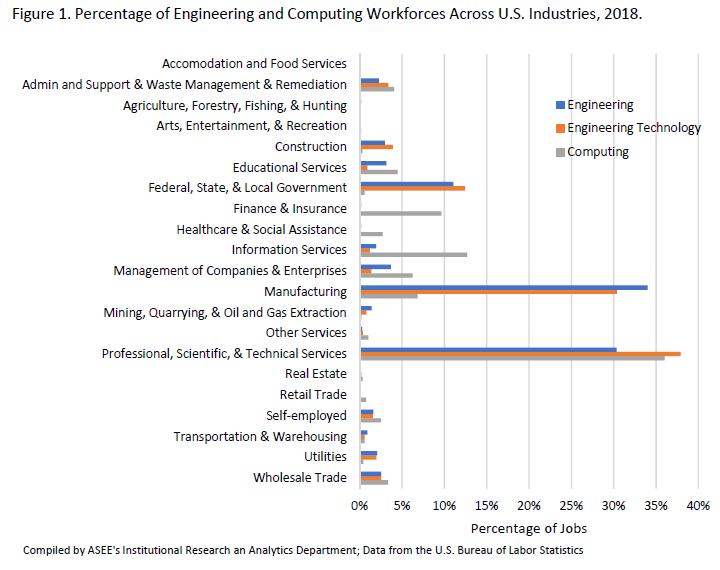
Approximately 75% all employed engineers in the United States worked in the manufacturing industry, professional, scientific, and technical industry, and the federal, state, or local government in 2018 (Figure 1). It is worth noting the professional, scientific, and technical industry tends to include most science and engineering jobs that do not fit within the other defined industries in the U.S. Many of the jobs in the professional, scientific, and technical industry are connected to research facilities, testing laboratories, and architectural engineering. With the continued modernization of the workforce leading to more use of computer programming and new technology, this industry continues to show strong growth in the number of science and engineering jobs counted each year. However, engineers were found within all major industries, including the more service-oriented industries, such as retail, arts and entertainment, accommodation and food services, and real estate. Among all employed engineers in 2018, almost half are civil engineers, mechanical engineers, and industrial engineers. The fewest number of engineers were in the occupations of agricultural engineers, mining and geological engineers, and marine engineers likely due to the specialized nature of those occupations.
The median annual salary for all engineers in 2018 was $94,600. The engineering occupations with the highest median annual salaries were engineering managers ($140,760), petroleum engineers ($137,170), and aerospace engineers ($115,220). The occupations with the lowest median annual salaries were industrial engineers ($87,040), civil engineers ($86,640), and agricultural engineers ($77,110). However, the median annual salaries for all engineering occupations were much higher than $38,640, the median annual salary for all U.S occupations in 2018 (Figure 2).
The engineering workforce requires highly skilled and trained individuals to meet the needs of the global industrial workforce. While many of the skills gained by those with engineering postsecondary degrees are tailored to future employment in engineering, these skills are highly desired and transferrable to other areas in the scientific workforce. According to data collected in 2017 by the National Science Foundation’s National Survey of College Graduates, 25% of engineering bachelor’s graduates, 29% of engineering master’s graduates, and 35% of doctoral engineering graduates worked within a different science or science-related field for their principal job, and 20% of bachelor’s graduates, 14% of master’s graduates, and 14% of doctoral graduates in engineering worked within a non-science or engineering related field for their principal job. Many of the jobs held in a non-science or engineering related field tended to be in management or management-related occupations. However, nearly everyone working in an engineering occupation held an engineering degree as their terminal degree. Approximately 86% of bachelor’s graduates working in engineering held a terminal engineering degree, 75% of master’s graduates working in engineering held a terminal engineering degree, and 79% of doctoral graduates working in engineering held a terminal engineering degree. While a terminal degree in engineering is a strongly encouraged prerequisite for any job in the engineering workforce, the outliers to that were the 16% of master’s graduates with a terminal degree in management and administration and the 12% of doctoral graduates with a terminal degree in the physical sciences.
A lack of gender and racial and ethnic diversity among engineers continues to be an issue that needs to be addressed. Within the engineering workforce in the United States, only 14% of engineers are women and 13% of engineers are from underrepresented racial and ethnic groups (African American, Hispanic, Native American/Native Alaskan, and Hawaiian/Pacific Islander).
Engineering Technology Occupations
Similar to the engineering occupations, while all major industries hired engineering technicians and technologists, approximately 80% of all employed engineering technicians and technologists in the United States worked in the professional, scientific, and technical services industry, the manufacturing industry, and the federal, state, or local government in 2018. Among all employed engineering technicians and technologists in 2018, approximately 45% were electrical and electronic engineering technicians, architectural and civil drafters, and engineering technicians and technologists not counted in the other occupation categories. The fewest number of engineering technicians and technologists were in the occupations of aerospace engineering and operations technicians and electro-mechanical technicians.
The median annual salary for all engineering technicians and technologists in 2018 was $55,920. While the fewest number of technicians and technologists worked in the aerospace engineering and operation technician occupation, that occupation had the highest median annual salary among all technician and technologist occupations at $67,010. Other higher median salaries could be found in the electrical and electronics engineering technician occupation ($64,330) and the “other” engineering technician occupation ($63,200). The median annual salaries for all engineering technician and technologist occupations were all higher than $38,640, the median annual salary for all U.S. occupations.
While the gender and racial and ethnic diversity among engineering technicians and technologists are still low, both groups are better represented than within engineering occupations. Within the engineering technology occupations in the United States, 17% of engineering technicians and technologists are women and 21% of engineering technicians and technologists are from underrepresented racial and ethnic groups.
Computing Workforce
The computing workforce has become more and more integrated with the engineering workforce as the computational skills become increasingly necessary for engineers to be successful in their careers. While all major industries hired computational workers, 58% worked in the professional, scientific, and technical services industry, information services industry, and the finance and insurance industry in 2018. Among all employed computational workers in 2018, approximately half were software developers of applications, computer systems analysts, and software developers of systems software. The fewest number of computational workers were in the occupations of postsecondary computer science teachers and computer and information research scientists. Both of these occupations are more focused on research and tend to require higher degrees, such as doctorates. Considering the job opportunities and high salaries available for trained computational workers with bachelor’s degrees, there may be less incentive to work towards higher degrees in computer sciences leading to jobs in those occupations.
The median annual salary for all computing and computer science occupations in 2018 was $90,270. The computational occupations with the highest annual median salaries were computer and information systems managers ($142,530), computer and information research scientists ($118,370), and software developers or systems software ($110,000). The occupations with the lowest annual median salaries were postsecondary computer science teachers ($82,220), network and computer systems administrators ($82,050), and web developers ($69,430). However, the median annual salaries for all computational occupations were much higher than $38.640, the median annual salary for all U.S occupations in 2018.
When viewing the computing workforce as a whole, the distribution of computer science degree holders differs from the distribution of those that hold an engineering degree. While only approximately half of engineering degree holders work their principal job in engineering, 61% of bachelor’s graduates, 67% of master’s graduates, and 72% of doctoral graduates with computer science degrees work in the computing workforce in 2017, according to NSF’s National Survey of College Graduates. Also, compared to the engineering workforce, there are higher percentages of individuals with degrees in other fields working in the computing workforce. With the increase in computational skills in higher education, workforce development, and on the job, these skills have been integrated into the education and development of scientists and engineers making these individuals marketable as potential employees in the computing workforce. Therefore, fewer computer science degree holders are needed outside of the computing workforce, which may lead to these individuals choosing career paths that remain in the computing workforce.
Within the computing workforce, the percentage of women is higher than both the engineering and engineering technology occupations, but the racial and ethnic diversity of the computing workforce is only a little higher than the engineering occupations. In the computing workforce, 24% of computational workers are women and 15% of computational workers are from underrepresented racial and ethnic groups.
Future Engineering and Computing Workforce
Over the next decade, the available jobs within engineering occupations are predicted to increase by 5%; the available jobs within the engineering technology occupations are predicted to increase by 2%; and the available jobs in the computing occupations are predicted to increase by 13%. For comparison, the available jobs in the entire U.S. workforce are predicted to increase by 5.2%, and the available jobs within the entire U.S. STEM workforce are predicted to increase by 8.8%. The growth in STEM jobs is predicted to be mostly driven by the increase in computational and mathematical jobs over the next decade.
When considering the engineering occupations, the industries predicted to show the highest percent growth in jobs are the construction industry by 13%, the healthcare and social assistance industry by 12%, and the agriculture, forestry, fishing, and hunting industry by 11% (Figure 3). It is important to point out that the healthcare industry and the agriculture industry had less than 5000 engineering jobs in 2018, so the percent growth in those industries will be higher than other industries that employ more engineers. The utilities industry is predicted to show a percent decrease in jobs by 2%, and the information services industry is predicted to show a percent decrease in jobs by 8% over the next decade. The occupations predicted to have the largest percent increases in jobs for engineers over the next decade are postsecondary engineering teachers by 11%, marine engineers and naval architects by 9%, and industrial engineers by 8%. However, the number of employed nuclear engineers and electronics engineers are predicted to each see a percent decrease by 1% over the next decade.
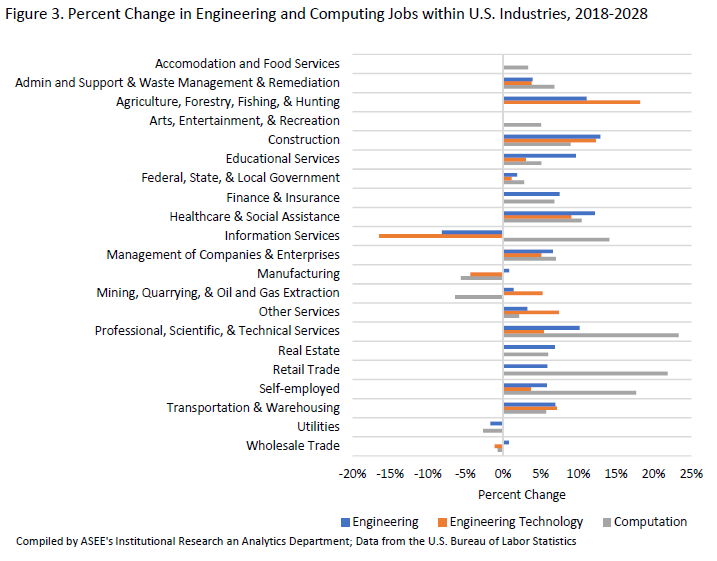
Similar to the engineering occupations, when considering the engineering technology occupations, the industries predicted to show the highest percent growth in jobs are the agriculture, forestry, fishing, and hunting industry by 18%, the construction industry by 12%, and the healthcare and social assistance industry by 9%. The wholesale industry is expected to have a percent decrease in jobs by 1%; manufacturing industry is expected to have a percent decrease in jobs by 4%; and the information services industry is expected to have a percent decrease in jobs by 16% over the next decade. The number of employed environmental engineering technicians and technologists are predicted to increase by 9%, and job growth of 5% is predicted among employed survey and mapping technicians and technologists, civil engineering technicians and technologists, and aerospace engineering and operations technicians and technologists. However, the number of employed industrial engineering technicians and technologists is predicted to decrease by 1%, and the number of employed mechanical drafters is predicted to decrease by 7%.
Within the computing workforce, the industries predicted to have the highest percent growth in jobs are the professional, scientific, and technical services industry by 23%, the retail trade industry by 22%, and the self-employed by 18%. Four industries are predicted to show a decrease in growth of computing jobs – wholesale trade industry by 1%, utilities industry by 3%, manufacturing industry by 6%, and the mining, quarrying, and oil and gas industry by 6%. Over the next decade the number of employed information security analysts is predicted to increase by 32%, and the number of employed software developers of applications is predicted to increase by 26%. The number of computer programmers is expected to decrease by 7% and is the only computing occupation with predicted negative percent growth.
With the predicted growth and high salaries for the engineering and computing workforces, these areas will continue to be lucrative career paths for recent graduates in these degree fields. The number of awarded bachelor’s and master’s degrees in engineering, engineering technology, and computer science have been steadily increasing over the past 15 years based on data collected through the American Association for Engineering Education’s (ASEE) Profiles of Engineering and Engineering Technology Colleges annual survey. These trends should continue along with the predicted increase in job availability in the workforce. The increasing usage of advanced computing methods such as machine learning and artificial intelligence in all areas of the U.S. workforce will likely drive the predicted growth in the computing and engineering workforces over the next decade, so it is necessary to make sure the future workforce is equipped with skills necessary to meet the demand driving workforce growth.
All data presented in this report and more can be found in the Microsoft Excel spreadsheet that accompanies this report.
Data Sources
Bureau of Labor Statistics
The BLS is a federal agency within the U.S. Department of Labor that measures the labor market activity, working conditions, price changes, and productivity in the U.S. economy, and they release their data for use by the public to support decision making. For this analysis, the datasets came from the BLS 10-year employment projections and the current population survey.
The BLS employment projections are published annually, and they are developed through a data analysis that combines data collected from the Occupation Employment Statistics survey, the Current Employment Statistics survey, and the Current Population Survey. The most recent release occurred in late 2019 presenting the employment statistics for 2018 and projecting employment out to 2028. This release was used for this analysis and report. The data is structured around the Standard Occupation Classification system and the North American Industry Classification System. For this analysis, the data was sorted and organized based on the occupations identified to represent the engineering, engineering technology, and computing workforces using the definitions in the Standard Occupation Classification system. This required reviewing the entire classification system in order to include occupations, such as managers and postsecondary teachers, in these fields that are not located in the same classification categories as most of the occupations in engineering and computer science. The employment counts for each industry is based on the number employed within the represented occupations for the workforces within each industry. For more information and descriptions of the various engineering and computing occupations, please visit O*Net Online (https://www.onetonline.org/), a site run by the U.S. Department of Labor.
The Current Population Survey is a monthly survey of households that is conducted by the U.S. Census Bureau. This survey collects data about a multitude of information related to the demographics and characteristics of the labor force. Diversity data was selected based on occupations within the engineering, engineering technology, and computing workforces.
More information and data about the U.S. labor force can be found at https://www.bls.gov/
National Science Foundation
The National Science Foundation’s National Center for Science and Engineering Statistics (NCSES) manages the distribution of multiple surveys focused on the education of scientists and engineers, the science and engineering workforce, research and development funding, and research facilities for science and engineering.
NSF’s National Survey of College Graduates is a cross-sectional biennial survey investigating the demographics and characteristics of the science and engineering workforce in the United States with postsecondary degrees. The analysis for this report used the 2017 public use data files released in August 2019. The data was sorted using the major degree field categories of science and engineering, i.e. Computer and Mathematical Sciences, Physical and Related Sciences, Biological and Related Sciences, etc.) as defined by NSF. The occupations used to define each of these categories for the principal jobs in science and engineering came from the Standard Occupations Classification System.
More information and data from NSF’s NCSES can be found at https://www.nsf.gov/statistics/
ASEE’s Profiles of Engineering and Engineering Technology Colleges
ASEE’s Profiles of Engineering and Engineering Technology Colleges survey collects data annually about programmatic elements of the engineering and engineering technology programs within postsecondary institutions in the United States and Canada, as well the number and demographics of students enrolled in these programs, the number and demographics of students awarded degrees, and the number and demographics of faculty working within the programs. The data collected from the Profiles survey is released for public use annually and can be found at http://profiles.asee.org/.
For this report, the number of bachelor’s, master’s, and doctoral degrees awarded to engineering, engineering technology, and computer science students from 1998-2018 was obtained from ASEE’s Engineering Data Management System (http://edms.asee.org/).
Download Report and Data
PDF: Current Status of the U.S. Engineering and Computing Workforce, 2019
Data: Workforce Trends 2019