ENGINEERING DEGREES AWARDED TO MINORITIES, BY REGION
By Charles Stuppard
Reprinted from ASEE Connections
The graphics below, drawing on 2018 ASEE data, compare the percentage of degrees awarded to underrepresented minorities (URMs) in engineering programs across the country. Underrepresented minorities are those who identify as African-American or Black, Hispanic/ Latinx, American-Indian/ Alaska Native, or Native Hawaiian/ Other Pacific Islander.
Among all graduates in 2018, 4.7% of degrees were awarded to URMs. Table 1 shows the median for each region and the respective breakdown by institution type. The total regional median is in line with the doctoral median, since most of the institutions with engineering programs are advanced research institutions. The Southwest Region had the highest percentage of URM graduates at 7.4%. When viewing the baccalaureate figures, it is important to note that the Mideast Region has six institutions, while none of the other regions has more than 3 eligible institutions.
Table 1. Median Percentage of URM Graduates
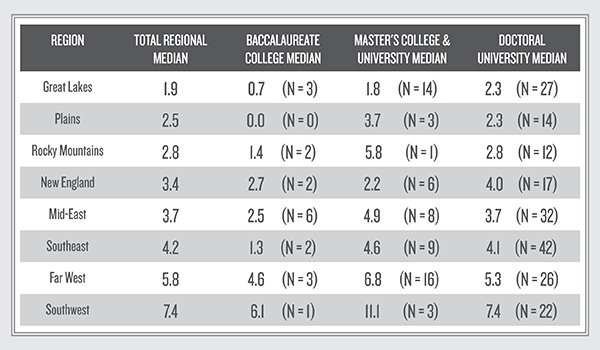
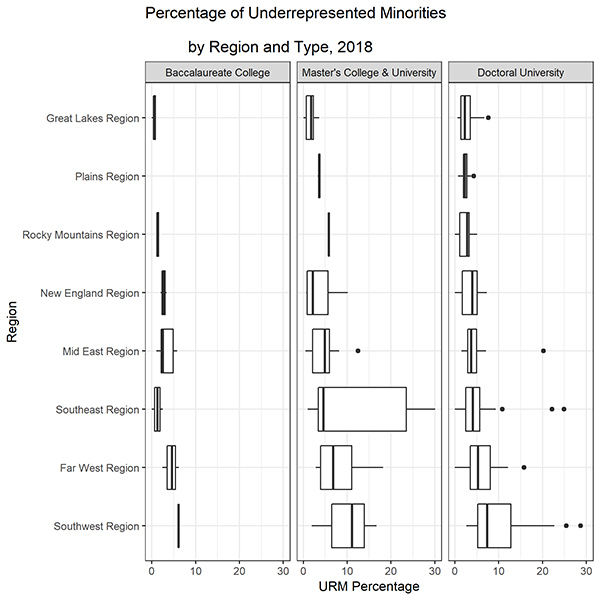
Figure 1, below, shows the percentage of URMs by region and is further broken down by institution type. Figure 2 shows the additional regional breakdown by type. The Southwest Region had the most variance while the Southeast Region had the most institutions with at least 20% URM graduates.
Figure 1. Percentage of Underrepresented Minorities by Region, 2018
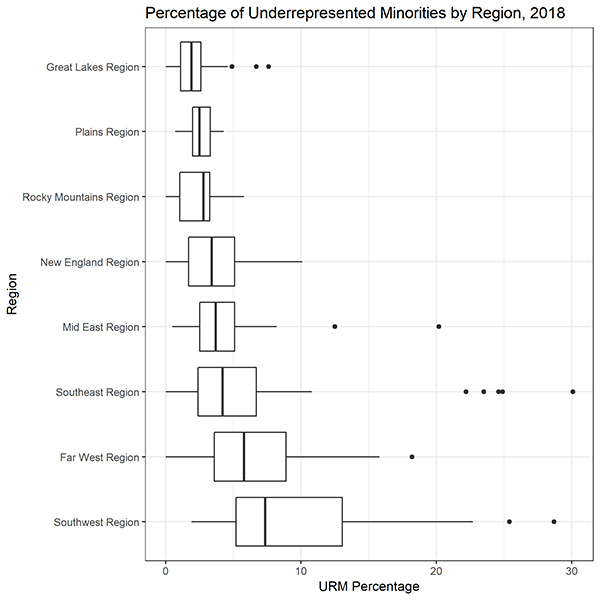
Figure 2. Percentage of Underrepresented Minorities by Region and Type, 2018