User Guide: ASEE Engineering Data Management System (EDMS)
(Updated April 2023)
This guide will help users navigate ASEE’s updated reporting tool in order to create, manage, and view reports.
The ASEE Engineering Data Management System (EDMS) is provided as a service to deans of engineering and engineering technology colleges who annually contribute data to ASEE’s database. Contained within the tool is data contributed to the Engineering and Engineering Technology College Profiles from 1998-2023. Access to the EDMS is granted on a one-year basis to institutions that contributed data for the previous survey cycle; Corporate Members of ASEE receive access to this program at a discounted rate as part of their membership privileges; Non-institutional members should inquire about the fee structure for twelve-month access to the data. If your institution contributed data in the previous survey cycle, but does not have access to this system, or for other access inquiries, contact the Institutional Research and Analytics department at data@asee.org.
The most recent information for individual schools is also located in our free Directory of Engineering and Engineering Technology Colleges at http://profiles.asee.org/.
* * * *
Table of Contents
- Accessing the EDMS
- EDMS Homepage
- Groups
- “ASEE Groups”
- “My Groups”
- Creating Groups
- Reports
- Reports Directory
- Creating Reports
- Column Modifiers
- Setting Conditions
- Aggregate Sum
- Sorting
- Common Issues
- Additional Tips
- Research Expenditures
* * * *
Accessing the EDMS
Access to the EDMS is available through a registered https://survey.asee.org/ account. New accounts can be created during the open survey cycle or by contacting data@asee.org.
To reset a forgotten account password, use this link: https://survey.asee.org/Identity/Account/ForgotPassword
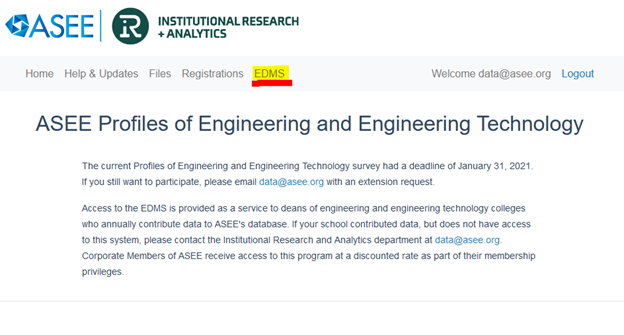
After logging in to https://survey.asee.org/, click the EDMS tab (highlighted below) to get directed the EDMS homepage. If you do not see “EDMS” as an option, please email data@asee.org to get the EDMS role added to your account.
 If the options are not visible, adjust the window size or click the trilinear “Menu”
 ![]() symbol in the top-right of the screen to expand the option selections.
symbol in the top-right of the screen to expand the option selections.
If the EDMS tab is not visible…
- the EDMS role may need to be added your account;
- your institution participated but the access dates may have expired and need to be updated;
- the institution did not participate in the previous survey cycle.
Contact your institution’s ASEE administrator or data@asee.org to resolve login or registration issues.
* * * *
EDMS Homepage
The EDMS tab from https://survey.asee.org/ will direct the user to the EDMS homepage.
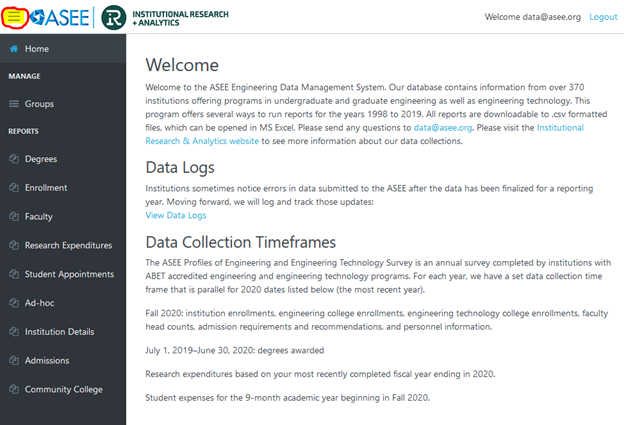
The EDMS homepage is the hub for EDMS-related communications. These sections will keep users informed of key information and updates.
On the left of the page, the darkened sidebar contains the Navigation Menu; it is the main directory for the EDMS. If the Navigation Menu is not visible, adjust the size of the window or click the trilinear menu button ![]() next to the ASEE logo at the top-left of the screen.
next to the ASEE logo at the top-left of the screen.
The Logout button is located on the top right of the page, next to the username/ email address of the account.
* * * *
Groups
Clicking on Groups from the Navigation Menu will direct the user to the Groups page. (Note: “My Groups” is blank until user-created groups are added.)
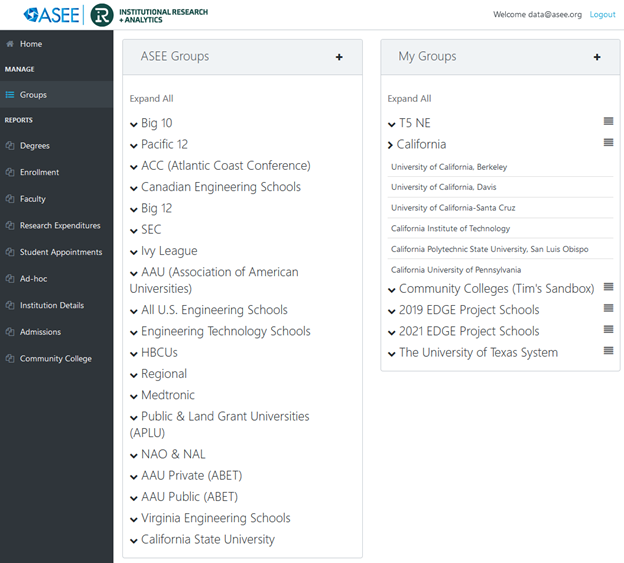
Groups are collections of institutions that have been set either by ASEE (“ASEE Groups”) or created by the user (“My Groups”).
To view/expand the institutions within the group, click on the group name. (as seen above in My Groups – California).
Using a group will limit the report results to only the specified institutions included in that Group. Groups must be added as a Condition when running a report; otherwise, the default condition (no set condition) will return all available results from all institutions. This is further explained in the Reports section, Setting Conditions.
ASEE Groups
“ASEE Groups” have been set by ASEE and are visible to all users. To suggest any additions and edits to ASEE Groups, contact data@asee.org.
My Groups
Users may create, manage, and view their own groups in the “My Groups” section of the Groups page. These are only visible to the user.
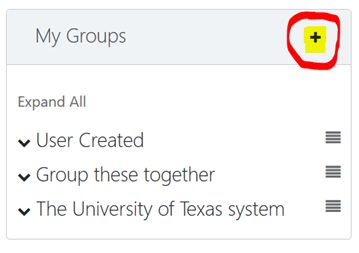
Creating a Group
A Group can be created using the following five steps:
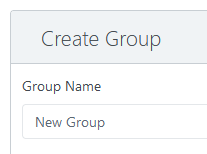
- Click the (+) icon to access the Create Group page.
- Add a Group Name.
- Select institutions of interest from “Schools”.
- Move selections from “Schools” to “Schools Group”.
- Click the blue Save button.
EXAMPLE: Using the five steps to Create a Group, the example below will create a group named “New Group” comprised of three institutions: University of Alabama at Birmingham, University of Arkansas, and Air Force Institute of Technology. The result will appear in the My Groups section.
- To create a new group, click the ( + ) icon to access the Create Group page.
- In the Create Group page, enter “New Group” in the Group Name text box.
- Select the institutions to be included in the group from “Schools”.
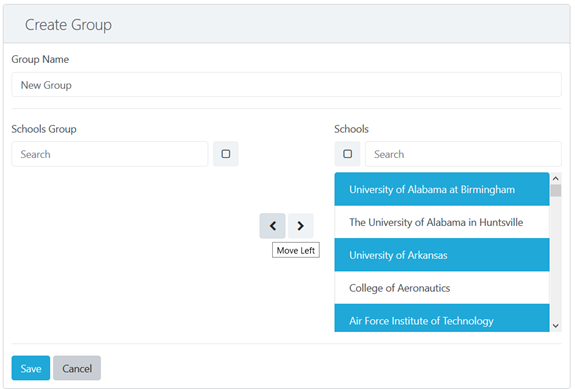
- Select the institutions to be added to the group from the “Schools” column on the right. Scroll or use search bar to find and select the institutions to be added to the new group. Institutions may be selected concurrently. For this example, University of Alabama at Birmingham, University of Arkansas, and Air Force Institute of Technology are selected.
- Move the selected institutions from “Schools” to “Schools Group”.
- Use the “Move Left” ( < ) or “Move Right” ( > ) arrows to add or remove institutions between “Schools” and “Schools Group”. For this example, Click the “Move Left” arrow ( < ) after selecting the institutions.
- Only the institutions appearing under the “Schools Group” section are included in “New Group”.
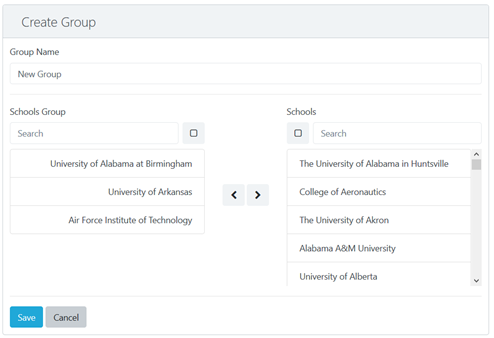
- Note: If the institution does not return to its alphabetical position, use the search bar or check the bottom of the scroll menu.
- Click Save.
- IMPORTANT: If the Save button is not pressed before continuing, the group will not be saved and the process must be repeated.
- “New Group” now appears under “My Groups”. Clicking on “New Group” expands the group, revealing the target institutions (University of Alabama at Birmingham, University of Arkansas, and Air Force Institute of Technology) are included in this group.
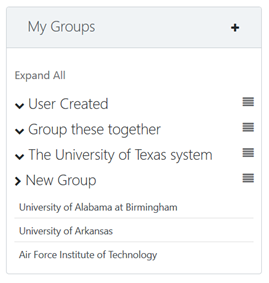
Repeat this process to create additional Groups.
To Edit or Remove a group, click the menu button ![]() to the right of the Group name.
to the right of the Group name.
** Note: By default, reports will return all available results from the database, including all institutions. To limit the report results to only the institutions of a Group, the Group condition must be set. Conditions are explained in the Creating Reports section of this guide.**
* * * *
Reports
Similar to Groups, users may create, manage, and view customized reports.
Clicking on a report type from the navigation sidebar will direct the user to a report’s page. Each page consists of four main windows, as labeled (A, B, C, D) in the image below.
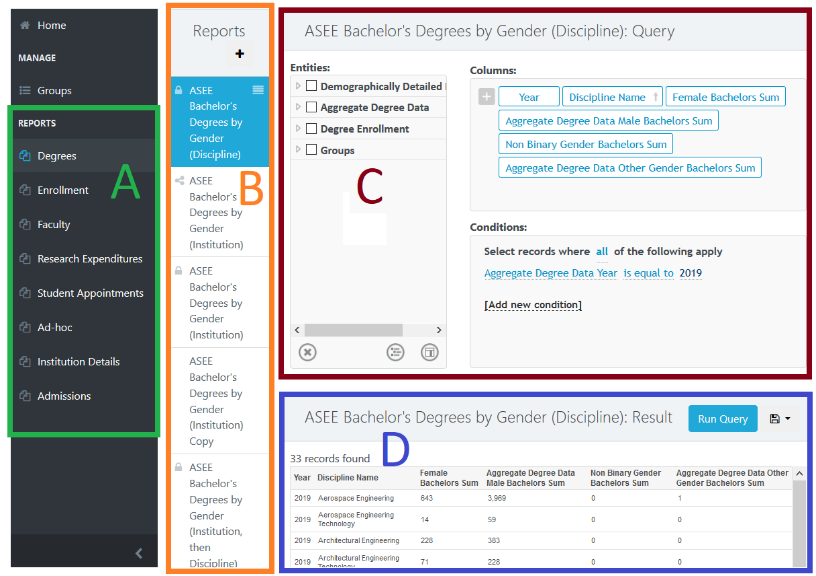
A — Reports Directory
B — Reports window
C — Query window
D — Results window
A) The Reports Directory in the navigation sidebar categorizes the reports based on relevant data fields. Generally, data fields are available only within their specific report type (i.e. enrollment data is only visible in the Enrollment section or faculty data in the Faculty section); however, some fields are available in multiple sections, such as Year, School Name, Discipline, and Groups. The Reports Directory selection determines the available option in the Reports Window (B) and in the Entities column in the Query window (C).
A description of each Reports Directory selection is below:
- Degrees includes degree attainment data that is disaggregated by Race, Gender, and Degree level, as well as various aggregate totals. Program details are also included.
- Enrollment includes enrollment data that is disaggregated by Race, Gender, and Degree level, as well as various aggregate totals. Undergraduate data is disaggregated by classification (Freshman, Sophomore, Junior, Senior) due to the reporting structure of the Profiles survey.
- Faculty includes faculty data disaggregated by Race, Gender, and Rank, as well as various aggregate totals. Full-time and part-time research and teaching faculty data is included here along with Total Tenured/Tenure-Track Faculty counts.
- Research Expenditures includes research expenditure data disaggregated by type.
- Student Appointments includes student appointment and stipends data.
- Ad-hoc contains details about Master’s Programs, Department Heads, and Research Centers.
- Institution Details returns degrees awarded data in long (tidy) format.
- Admissions includes details about admissions, degree offerings, and assessment scores.
- Community College includes publicly available federal data for two-year colleges. Development and testing of this section is ongoing. The full dataset is to be integrated into the data collections of the Profiles survey.
B) The Reports Window shows the list of available reports based on the selection from the Reports Directory. Additional report queries may be added by clicking the plus (+) icon, as explained in the “Creating Reports” section.
- Reports shared by ASEE have a lock symbol (
 ).
). - Reports shared by the user’s Admin account have a “share” symbol (
 ).
). - Reports created by the user will not have a symbol and are only visible to that user.
- To Edit, Duplicate, or Remove a Report, click the menu button
 to the right of the report name.
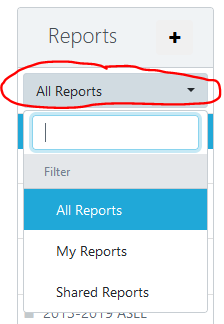
 - The filter dropdown menu (circled below) can be used to view 1) All Reports including both user-created and shared reports, 2) only My Reports (user-created), or 3) only Shared Reports.
C) The Query window displays the selected report’s name, along with three sub-windows – Entities, Columns, and Conditions – based on the selection from the Reports Directory. The Query fields set the parameters for the final report output.
- Entities contain the nested menu of available variables for the selected report type. These selections are added to the Columns sub-window.
- Columns display the Entities selections and appear as variables (columns) in the report (Results). Column modification options are useful when sorting and aggregating the report results. Generally, the
SUMfunction should be used in most cases of numerical observations. - Conditions are used to filter down the results and may be simultaneously applied. For example, two conditions are needed to return Environmental Engineering data for 2020. One condition sets the Year while a second condition sets the Discipline. If conditions are NOT added, the resulting report will display ALL query matches for the entire database (ie ALL institutions, ALL departments, ALL years, All disciplines, ALL results). Conditions need to be set for each report.
D) The Results window displays the query results after clicking “Run Query”. The results are based on the Columns and Conditions applied within the Query window. This report can be viewed within the EDMS webpage or exported to CSV or Excel. The Results window displays the report based on the applied Columns and Conditions within the Query window. Results are visible after clicking “Run Query”. Reports can be viewed within the EDMS webpage or exported to CSV or Excel. When viewing in the webpage, use the horizontal and vertical scroll bars and the numbered page selection to view the full results.
* * * *
Creating a Report
A Report can be created using these six steps:
- Select a report category from the Report Directory sidebar.
- Click (+) icon in the Reports window and add a report name.
- Select the Entities and add them to Columns.
- Use column modifiers to sort and aggregate variables.
- Add the conditions (i.e., year, discipline, groups, etc.).
- Click “Run Query”. Exporting and saving the report is optional.
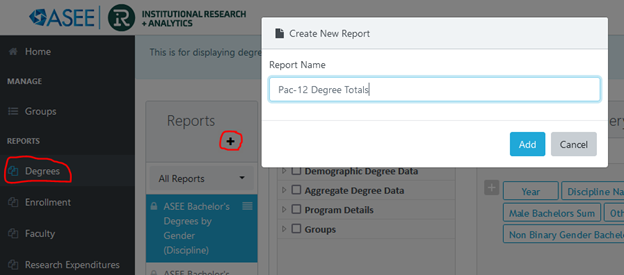
EXAMPLE: Using the six steps to Create a Report, the example below will create a report named “Pac-12 Degree Totals”, which returns the total number of Bachelors, Masters, and Doctoral degrees awarded in 2012 from Pacific-12 institutions.
- From the Reports Directory in the navigation sidebar, select Degrees. (Note: reports are only visible in the Reports Directory category in which the report is created. A report created in Degrees, will not appear in Enrollment and vice versa.)
- Click the (+) icon in the Reports window and enter the report name “Pac-12 Degree Totals”. Click Add.
- Select the Entities and add them to Columns.
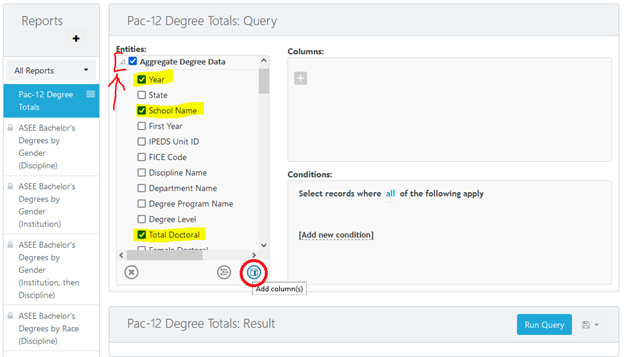
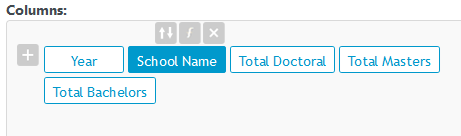
- The variables are nested within “Aggregate Degree Data” menu. Click the triangle icon next to the checkbox to expand the “Aggregate Degree Data” menu. Select Year, School Name, Total Doctoral, Total Masters, and Total Bachelors. The vertical scroll bar is used to view additional entities.
- After selecting the Entities, click the ‘Add Columns’ button
 located at the bottom-right of the Entities sub-window (circled in red).
- Use column modifiers to sort and aggregate variables. This example will alphabetically sort school names. Multiple columns may be sorted concurrently.
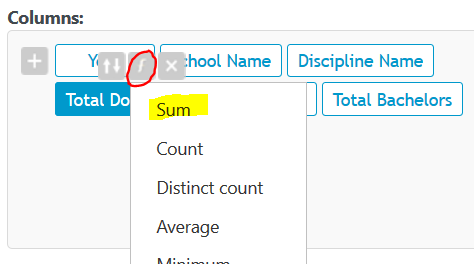
- The Column modifier pop-up menus is accessed by hovering the mouse pointer over the column name. The arrows symbol is for sorting; the function symbol applies various operations to columns; the X deletes the selection.
- To sort in school names in alphabetical order, choose the sorting symbol from the modifier pop-up menu, select Ascending. An arrow is then added to the column name
 . Select Descending to reverse the order. This is similarly applied to numeric variables.
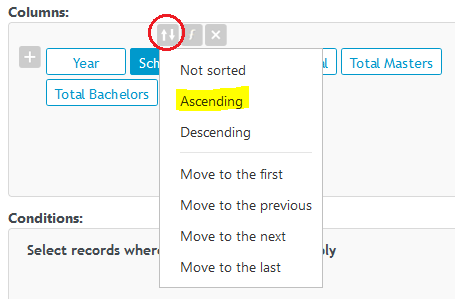
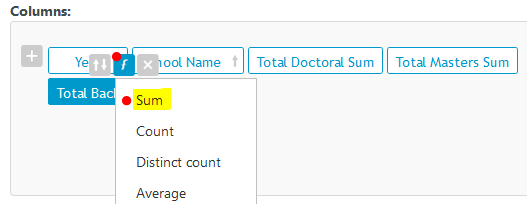
- Add aggregate column modifier to numeric columns to avoid seemingly duplicate rows (explained in the Common Issues section – Duplicate Row parameters). For Total Doctoral, Total Masters, and Total Bachelors, click on the aggregate column modifier ( f ), select “Sum”, and the column name will update to include the modifier.
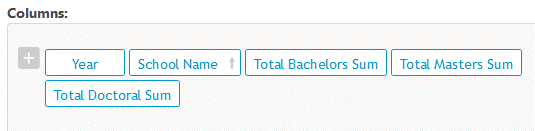
- Reorder columns by clicking and dragging column names to the desired placement.
- The Column modifier pop-up menus is accessed by hovering the mouse pointer over the column name. The arrows symbol is for sorting; the function symbol applies various operations to columns; the X deletes the selection.
- Add the conditions (i.e., year, discipline, groups, etc.).
- Running the Query at this point will return all query matches for the entire database. This report requires only 2012 data from Pacific-12 institutions. Therefore, two conditions are needed (Year and Group). First, the Group condition will be set, followed by the Year condition.
SETTING A CONDITION
Conditions are displayed in the following structure: [Entity-Column name] [logic operator] [value]. The Entity-Column name is the variable. The logic operator determines how, and which, values are filtered. If a singular value parameter is used, it is recommended to use “is equal to”. To multiselect several values, it is recommended to use “is in list”. The value is the parameter for the logic operator.
- To add the Group condition, click on [Add new condition] in the Conditions sub-window. A replica menu of the nested Entities selections will appear. Select “Groups”, then “Group Name”.
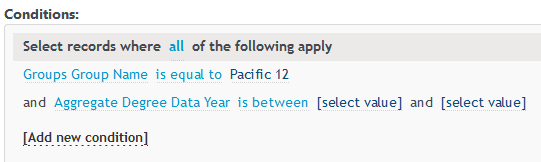
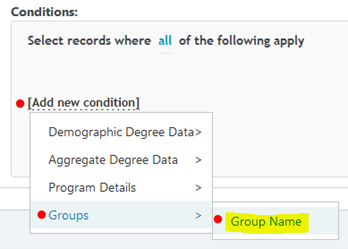 ** Notice the various parts of the condition structure. When completed with these selections, the [Entity-Column name] [logic operator] [value] format displays as [Groups Group Name] [starts with] [enter value], as shown below.**
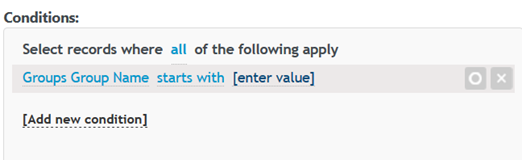
- Now that the Group condition is added, the next step is to set the parameters which will filter results to only those that match the condition. Otherwise, all institutions will be included.
- Click the logic operator “starts with” to bring up a logic operator menu.
- Select “is equal to”.
- Click on [enter value].
- Select “Pacific 12”.
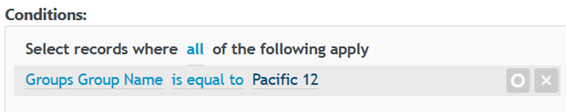
- The Group Condition is set. Running the Query will only return Pacific 12 participating institutions. (Note: conditions may be toggled or deleted by clicking the shaded O and X buttons.)
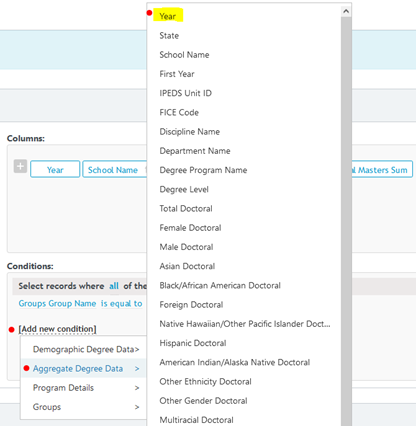
- To add the Year condition, click on [Add new condition] in the Conditions sub-window. Select “Aggregate Degree Data”, then select “Year”.
- Now that the Year condition has been added, the next step is to set the `2012` parameter. Otherwise, the report will return every year since 1998.
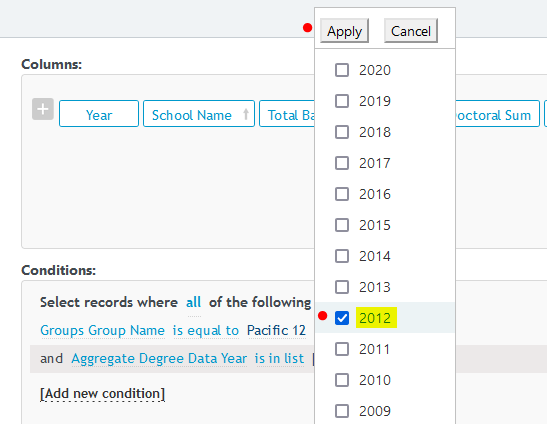
- The default operator may change based on the selection. The location in the format does not change. Click the logic operator “is between” to bring up a logic operator menu.
- Select “is in list”.
- Click on [select value].
- Click on “2012” and then “Apply”.
- Now that the Year condition has been added, the next step is to set the `2012` parameter. Otherwise, the report will return every year since 1998.
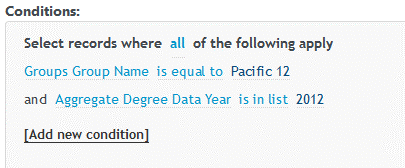
- Both the Group and Year conditions are set:
Click “Run Query”. Exporting and saving the report is optional.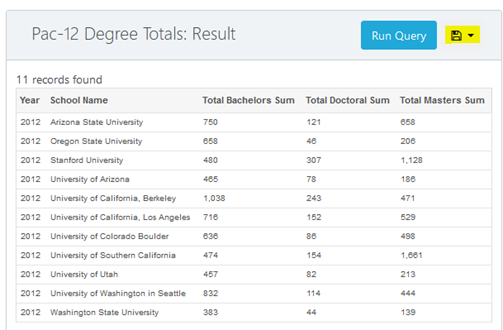
-
- Reports can be viewed within the EDMS webpage or exported to CSV or Excel by clicking the Save icon, next to “Run Query”.
- Repeat this process to create additional report queries.
- Refer to the shared ASEE reports for additional examples.
-
- In general, most reports should contain these conditions:
- Year – No set Year condition (default) contains ALL years since 1998.
- Disciplines – No set Discipline condition (default) contains ALL disciplines, including Engineering Technology and Computer Science (outside).
- Group Name – No set Group condition (default) includes ALL U.S. Engineering and Engineering Technology institutions in addition to Canadian institutions.
- In general, most reports should contain these conditions:
For assistance building a report and setting conditions, contact data@asee.org.
* * * *
Common Issues:
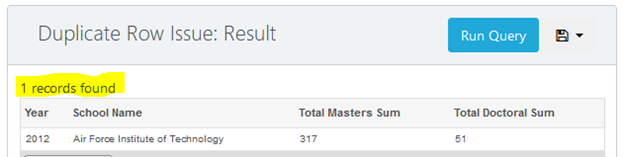
- DUPLICATE ROWS — the report is showing repeated or duplicated rows. Example: Total graduate degrees for Air Force Institution of Technology in 2012.
- Expected result: One row for the institution displaying the result, as below.
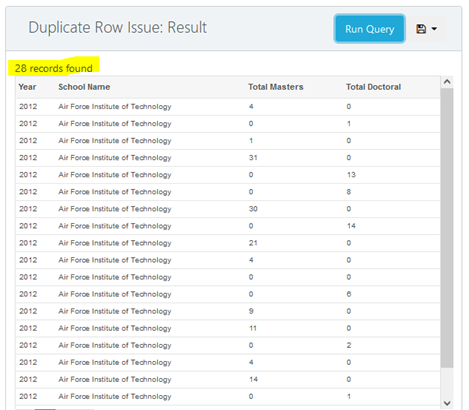
- Error Result: the graduate degrees report for Air Force Institution of Technology in 2012 returns 28 records with seemingly duplicate rows, shown below:
- Explanation of Error:
- The default report element is broken down by Degree Program. If the columns are not aggregated to “Total Masters Sum” and “Total Doctoral Sum”, the query will appear to contain duplicates.
- Within each institution, there may be numerous Degree Programs; each Degree Program is housed within a Department, which varies by institution; each Degree Program is matched to the best fit of an ASEE Discipline Categories (24 Engineering and 11 Engineering Technology). This precedence allows for comparison across institutions. More information about ASEE Disciplines can be found here: https://ira.asee.org/profiles-of-engineering-and-engineering-technology-instructions/#engineering-disciplines
- Adding Discipline Name, Department Name, Degree Program Name to the report query gives a clearer picture of the breakdown of resulting data. ** “Space Systems” returns 0 results and is removed in this example**
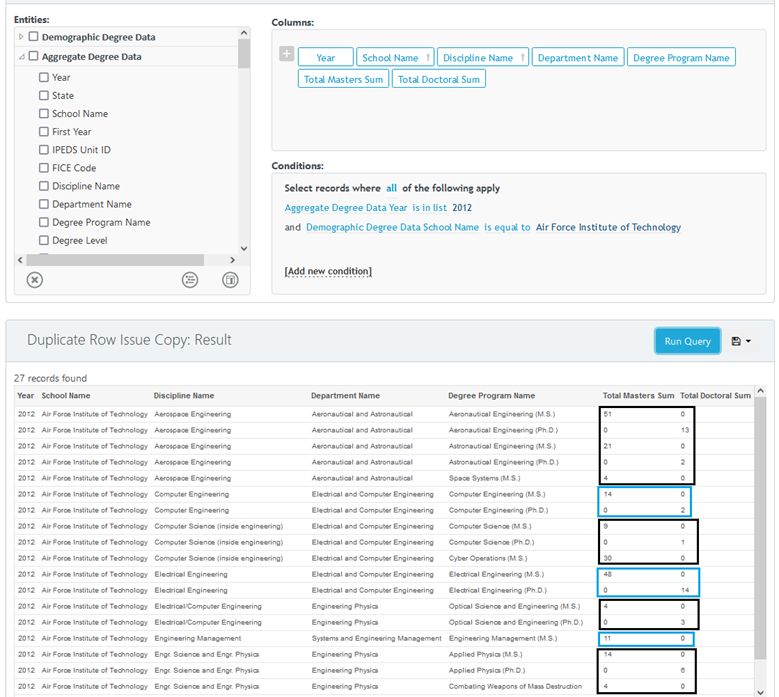
- The rows are not duplicated. Each Degree Program has its own row. The Degree Programs are housed in a Department; however, the Degree is also matched to a Discipline.
- Solution — Use the aggregate column modifier (Sum) on each numeric variable (Total Doctoral, Total Masters) and remove the more specific-level column variable (Degree Program Name).
- Expected result: One row for the institution displaying the result, as below.
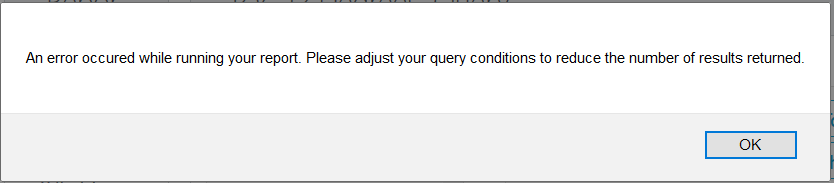
- Error/ timeout message:
-
- Possible Solution: There was an error in the Entity selection or it does not have any data.
- Possible Solution: The Conditions do not match the Entity selection.
- The report query shows “0 records found” or doesn’t return any results.
- Possible Solution – The Entity added to Columns must be the same as Condition’s [Entity-Column name]. Typically, this is a result of selecting a column variable that appears in multiple entities – “Year” appears in the Entities “Demographic Degree Data” & “Aggregate Degree Data”. The condition must match the same Entity that was selected.
- Possible Solution – Columns from multiple Entity menus were selected. The EDMS cannot create cross-entity reports at this time. Please create separate reports.
- Possible Solutions – If no data was reported, there is no data to be shown. Verify with similar ASEE reports.
-
- The default report element is broken down by Degree Program. If the columns are not aggregated, there will appear there are duplicates, based on Degree Program being the default reporting level.
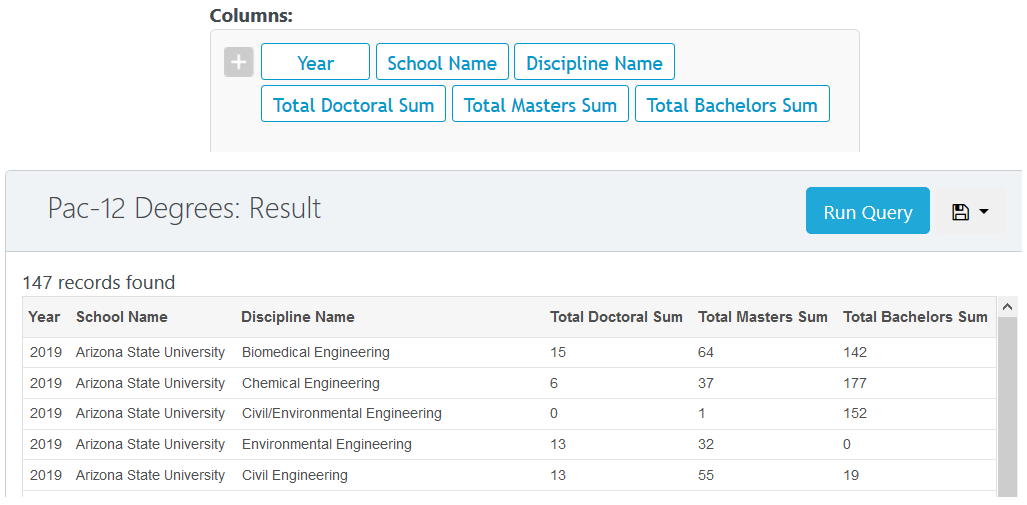
- Example – 2019 Arizona State University degrees awarded shows 573 records with duplicate rows, shown below.
- The default report element is broken down by Degree Program. If the columns are not aggregated, there will appear there are duplicates, based on Degree Program being the default reporting level.
-
-
- Adding Discipline Name, Department Name, Degree Program Name gives a clearer picture of how the data is pulled. Within each institution, there are Disciplines; within each Discipline, there are Departments; within each Department, there may be several Degree Programs.
-
-
-
- The rows are not duplicated. Each Degree Program has its own row.
- Solution – Use the aggregate column modifier (Sum) on each numeric variable (Total Doctoral, Total Masters, and Total Bachelors).
-
-
-
- After using the modifier, the Columns “Department Name” and “Degree Program Name” are removed. The values for each Department have aggregated into the Discipline level.
-
-
-
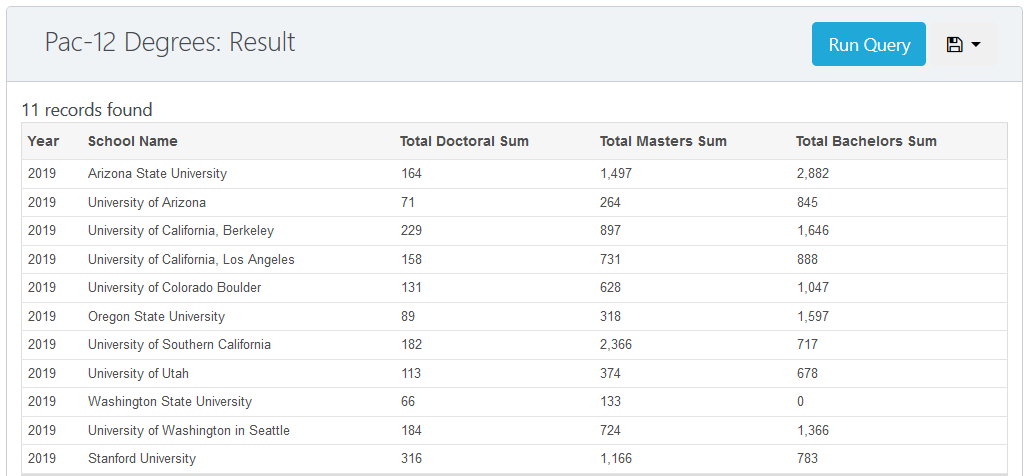
- Removing the column “Discipline Name”, the values aggregate further to the Institution level.
-
- Additional Tips
- Use the Duplicate feature to copy ASEE reports and use them as a guide. They can be modified and useful in understanding how reports are set up.
- Conditions are needed to filter down the query Results.
- Ad-hoc report directory has all entity options, including some that are not found in other reporting categories.
After troubleshooting and comparing ASEE report setup, contact data@asee.org for additional help.
Research Expenditures
Research expenditures are collected by department and by research center. Per the reporting rules (https://ira.asee.org/profiles-of-engineering-and-engineering-technology-instructions/research%20expenditures/) research center’s located in a department of engineering are excluded from the calculation of an institution’s total research expenditures as they are assumed to be reported in the department’s expenditures.
To construct the appropriate query, you need to include departments and research centers not located in an engineering department if you want to see the total research expenditures by discipline: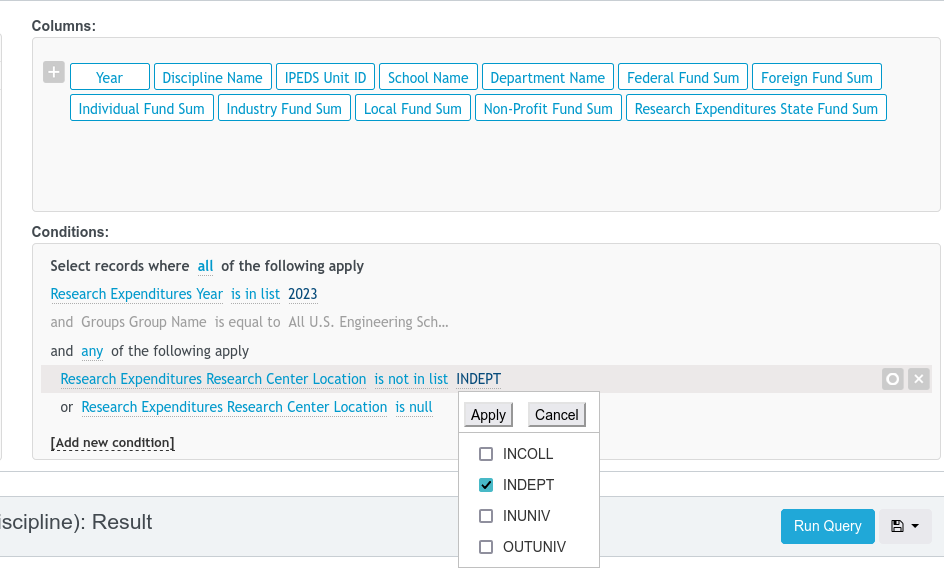
Department’s will have a “Research Center Location” of null and you are excluded any INDEPT (i.e. a research center located within an engineering department), from the total sums produced.