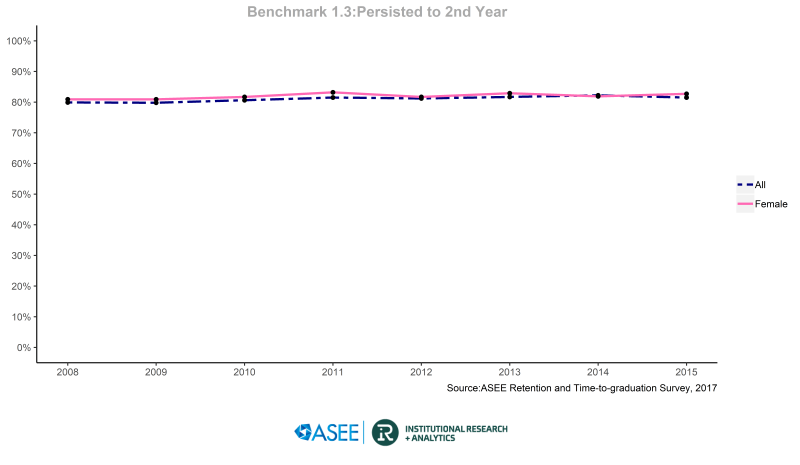
One important benchmark of retention is student persistence to the second year: what percent of first-time entering full-time students remain enrolled in the program after the first year of study. Overall, student persistence rate to the second year increased from almost 80 percent in 2008 to 81.5 percent in 2015. The second year persistence rate has remained remarkably stable throughout the time span of the retention survey. Each picture can be enlarged (by clicking on it) and downloaded. The persistence rate for engineering programs is similar to the national second year persistence rate for all programs in 4 year institutions in 2016-17 (81 %).
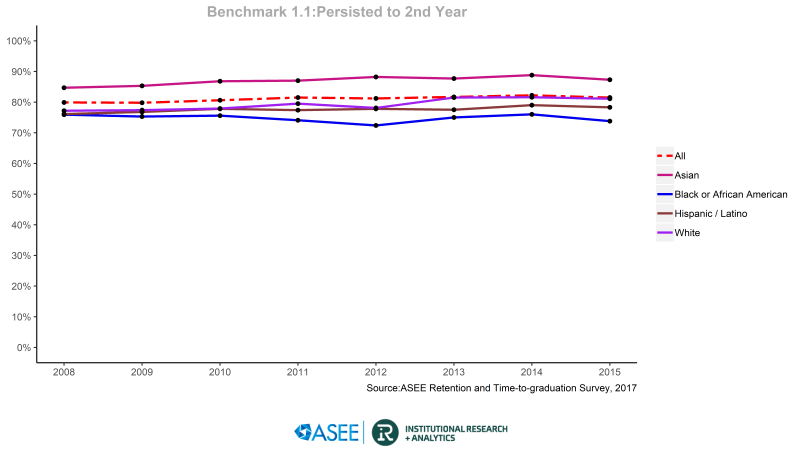
Benchmark 1.1 – Large Racial and Ethnic Groups
The first benchmark we present is persistence to the second year for race/ethnicity groups with a larger representation in the survey. There was a general decline in persistence rate from 2014 to 2015 across all these Ethnic Groups. Asian Americans showed the highest persistence to the second year. Their rate of almost 85 percent in 2008 increased to 87 percent in 2015. With the White students making up over 60 percent of the students reported in the survey, it is not surprising to see their rate mirror that of the national average. White student persistence rate was 77 percent in 2008, increasing to 81 percent in 2015. Persistence rates to the second year for Latino / Hispanic students was 76 percent in 2008, increasing to 78 percent in 2015, however their rates were about the same in 2010 to 2013. Black or African-American persistence rate of almost 76 percent in 2008 decreased to 73.8 percent in 2015.
Benchmark 1.1 2nd Year Persistence for Larger Ethnicity Groups[XLSX]
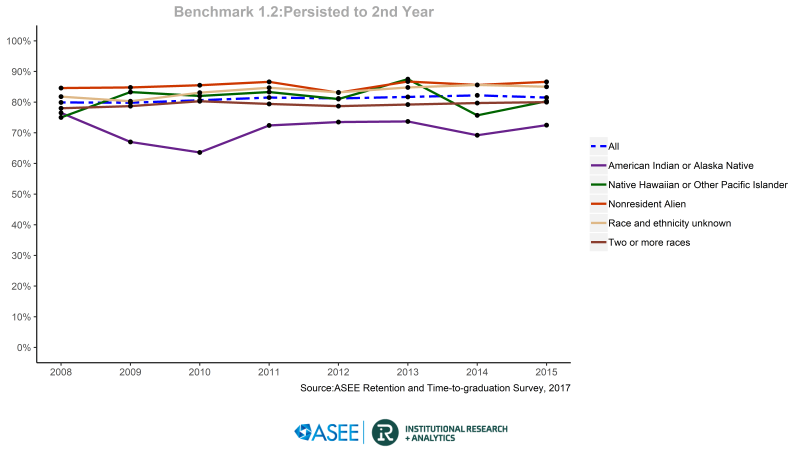
Benchmark 1.2 2nd Year Persistence for Smaller Racial/Ethnic Groups[XLSX]
Benchmark 1.3: 2nd Year Persistence for Women[XLSX]