The Diversity Benchmarking Report for Underrepresented Groups in Engineering is part of ASEE’s effort to capture the dispersion of underrepresented groups (URG) and provide national benchmarks of engineering and engineering technology programs. In this framework, underrepresented groups are partitioned into two subsets: A) underrepresented minorities (URM), including Black/ African American, Hispanic/ Latino, American Indian/ Alaska Native, and Native Hawaiian/ Other Pacific Islander and B) Asian women and White women (AWW). As a condition to capture racial and ethnic representation in a national context, this dataset excludes Non-Resident Aliens. The primary focus of this benchmarking report aims to provide a snapshot of the population percentage of both underrepresented groups, rather than establish a projection of future trends, for undergraduate full-time enrollment, undergraduate degrees attained, and full-time tenured/ tenure-track faculty from 2016 to 2018. Following an analysis for the national totals, each category will be further broken down by 1) Institution Type: Doctoral, Masters, Baccalaureate, 2) Carnegie Size: Large, Medium, and Small, and 3) Bureau of Economic Analysis (BEA) Region, to assess both underrepresented groups across various measures.
All data is sourced from the ASEE Survey of Engineering & Engineering Technology Colleges, an annual survey which profiles over 350 participating institutions. As of the release of this report, 2019 data collection is ongoing and not available. Supplemental tables are provided in the Appendix section. For more information, please contact Charles Stuppard in ASEE’s Department of Institutional Research and Analytics by phone (202) 350-5718 or by email c.stuppard@asee.org.
Analysis for All Institutions
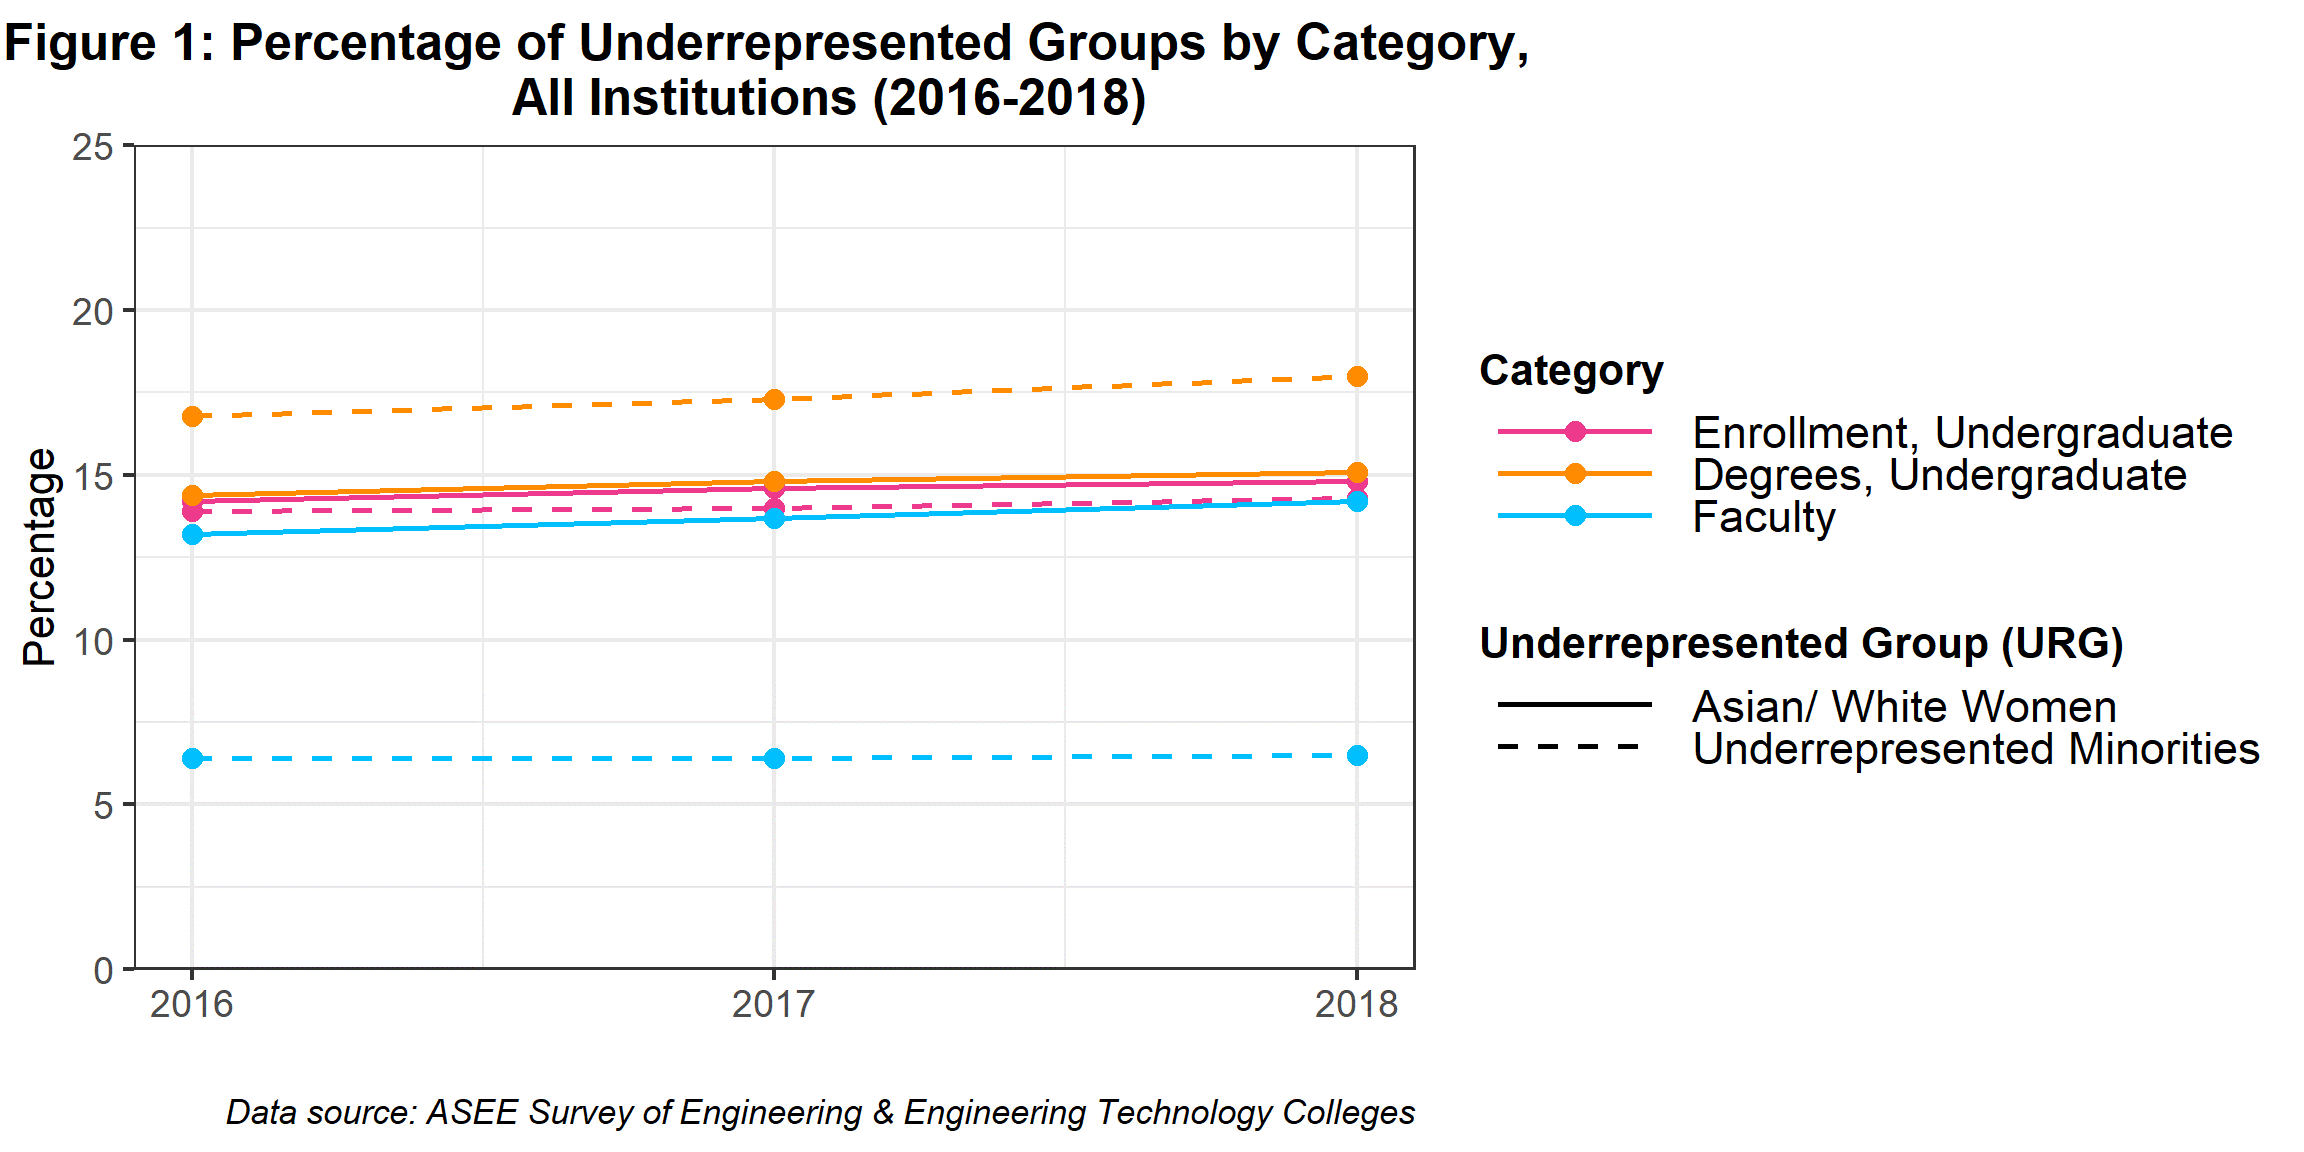
The percentage of both underrepresented minorities (URM) and Asian women and White women (AWW) decreased further along the academic pipeline; enrollment exhibited the highest percentage of representation, followed by bachelor’s degrees and faculty. The percentage of AWW remained consistent across all three categories, ranging from 13-15 percent. Conversely, the decline in the percentage of URM between enrollment and faculty is substantial. While URM accounted for 17.9 percent of undergraduate enrollment in 2018, higher than that of AWW, the percentage of underrepresented minorities in faculty drops to 6.5 percent. Figure 1 shows the percentage of each group by category.
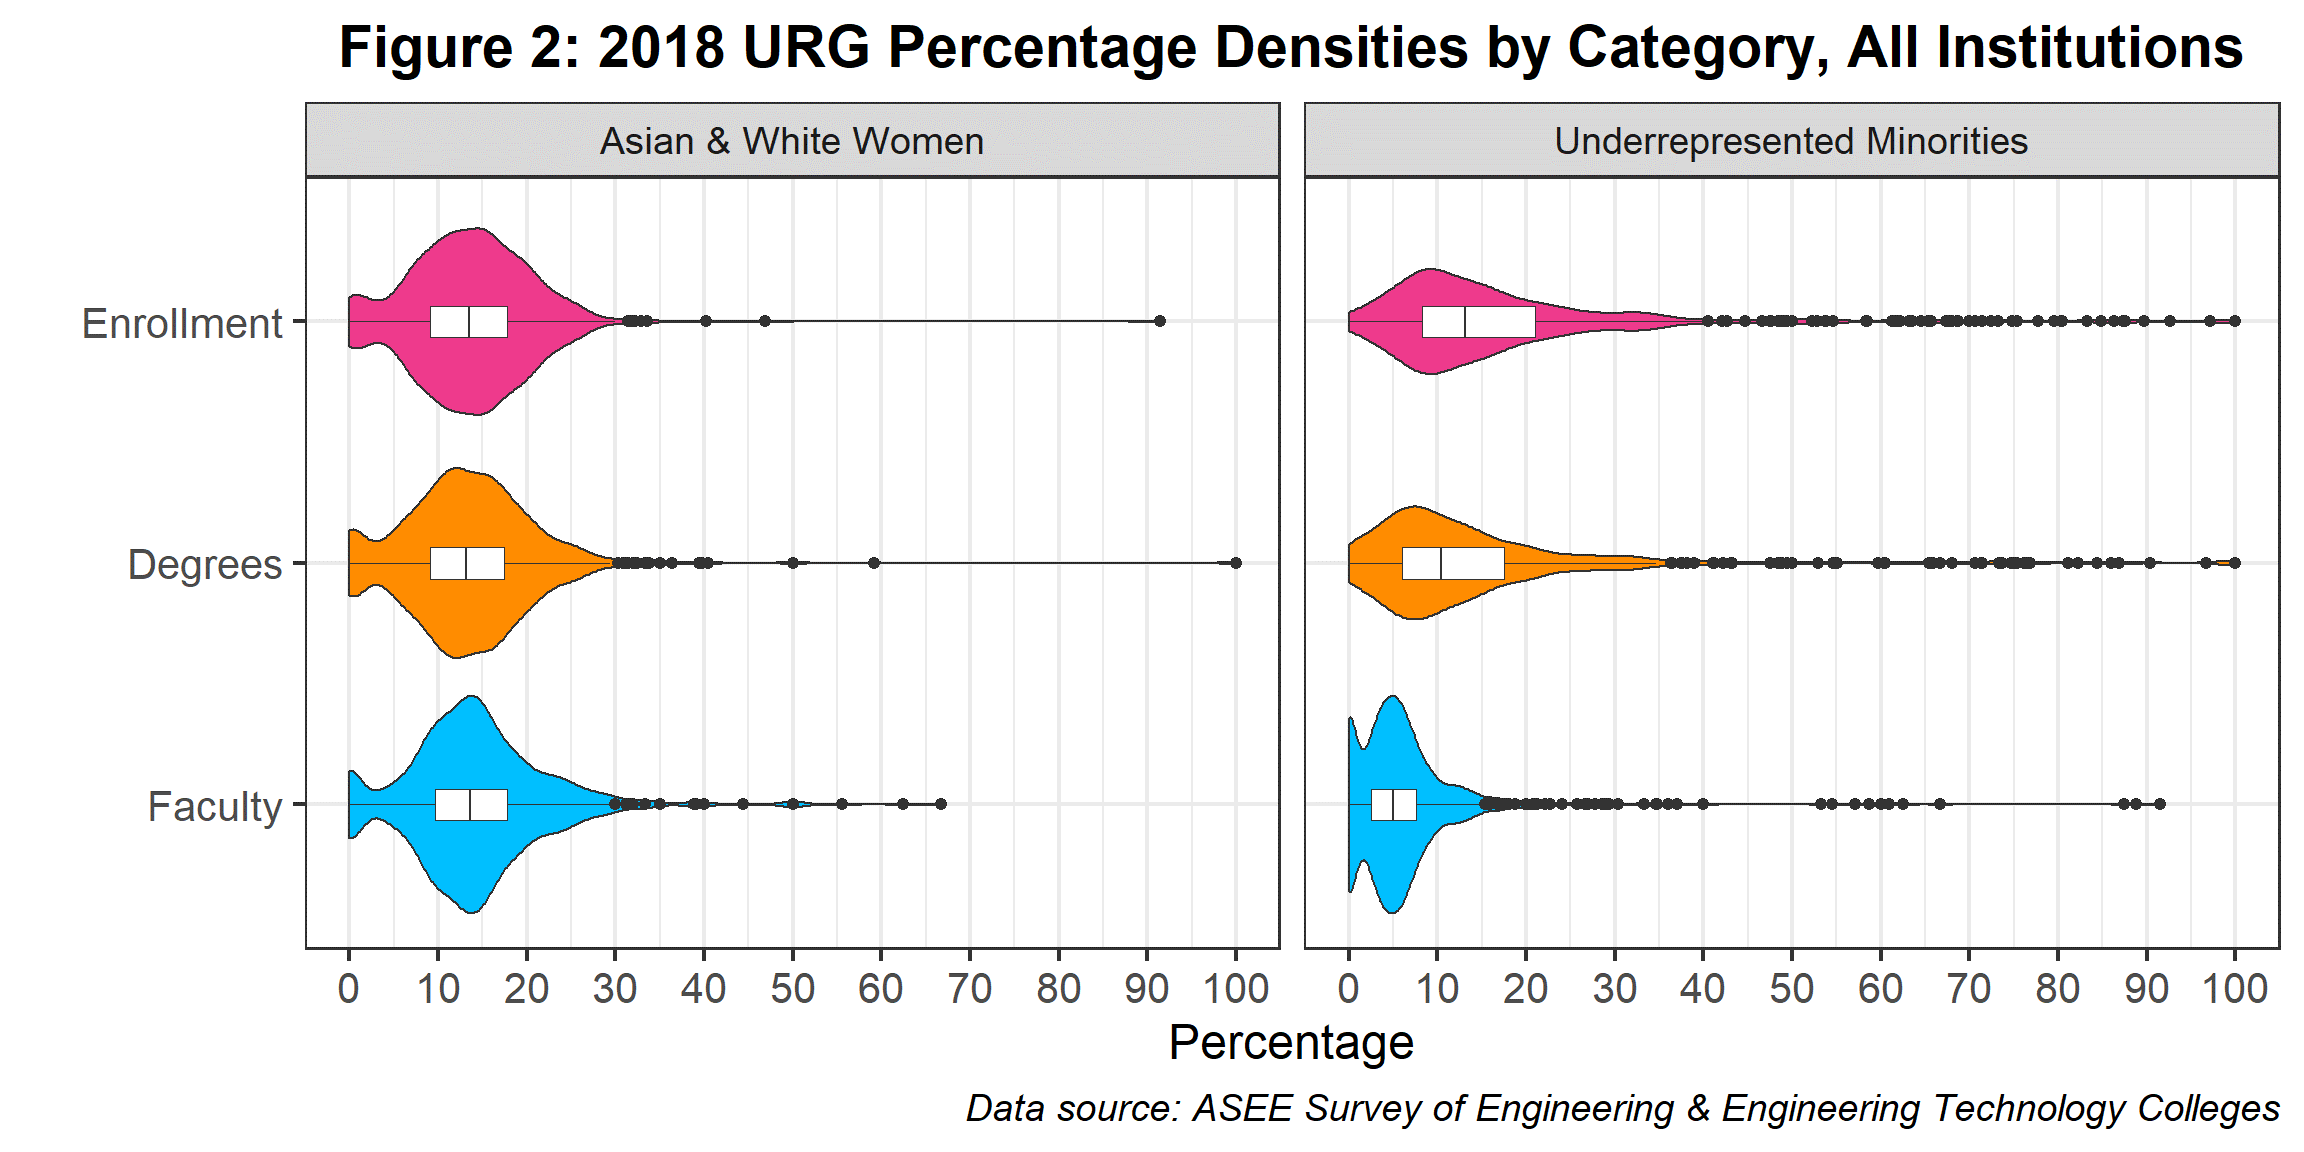
The distribution of 2018 percentages for all institutions is shown in Figure 2 and embedded with a summary box plot showing the minimum, maximum, first and third quartiles, median, and outliers. Wider sections show a higher density of percentages whereas narrower sections have a lower density. The shape and density peaks for AWW are aligned for all three categories. They exhibit a peak at zero, followed by a valley, a peak about a 13 percent median, and the maximum stretches to 30 percent with various outliers. The shape and density peaks for undergraduate enrollment and degrees are similar for URM. The peak of the distribution is near the first quartile and steadily decreases through the maximum, with outliers ranging to 100 percent. URM faculty reflects that of AWW – the peak at zero is followed by a larger peak around median.
Undergraduate Enrollment
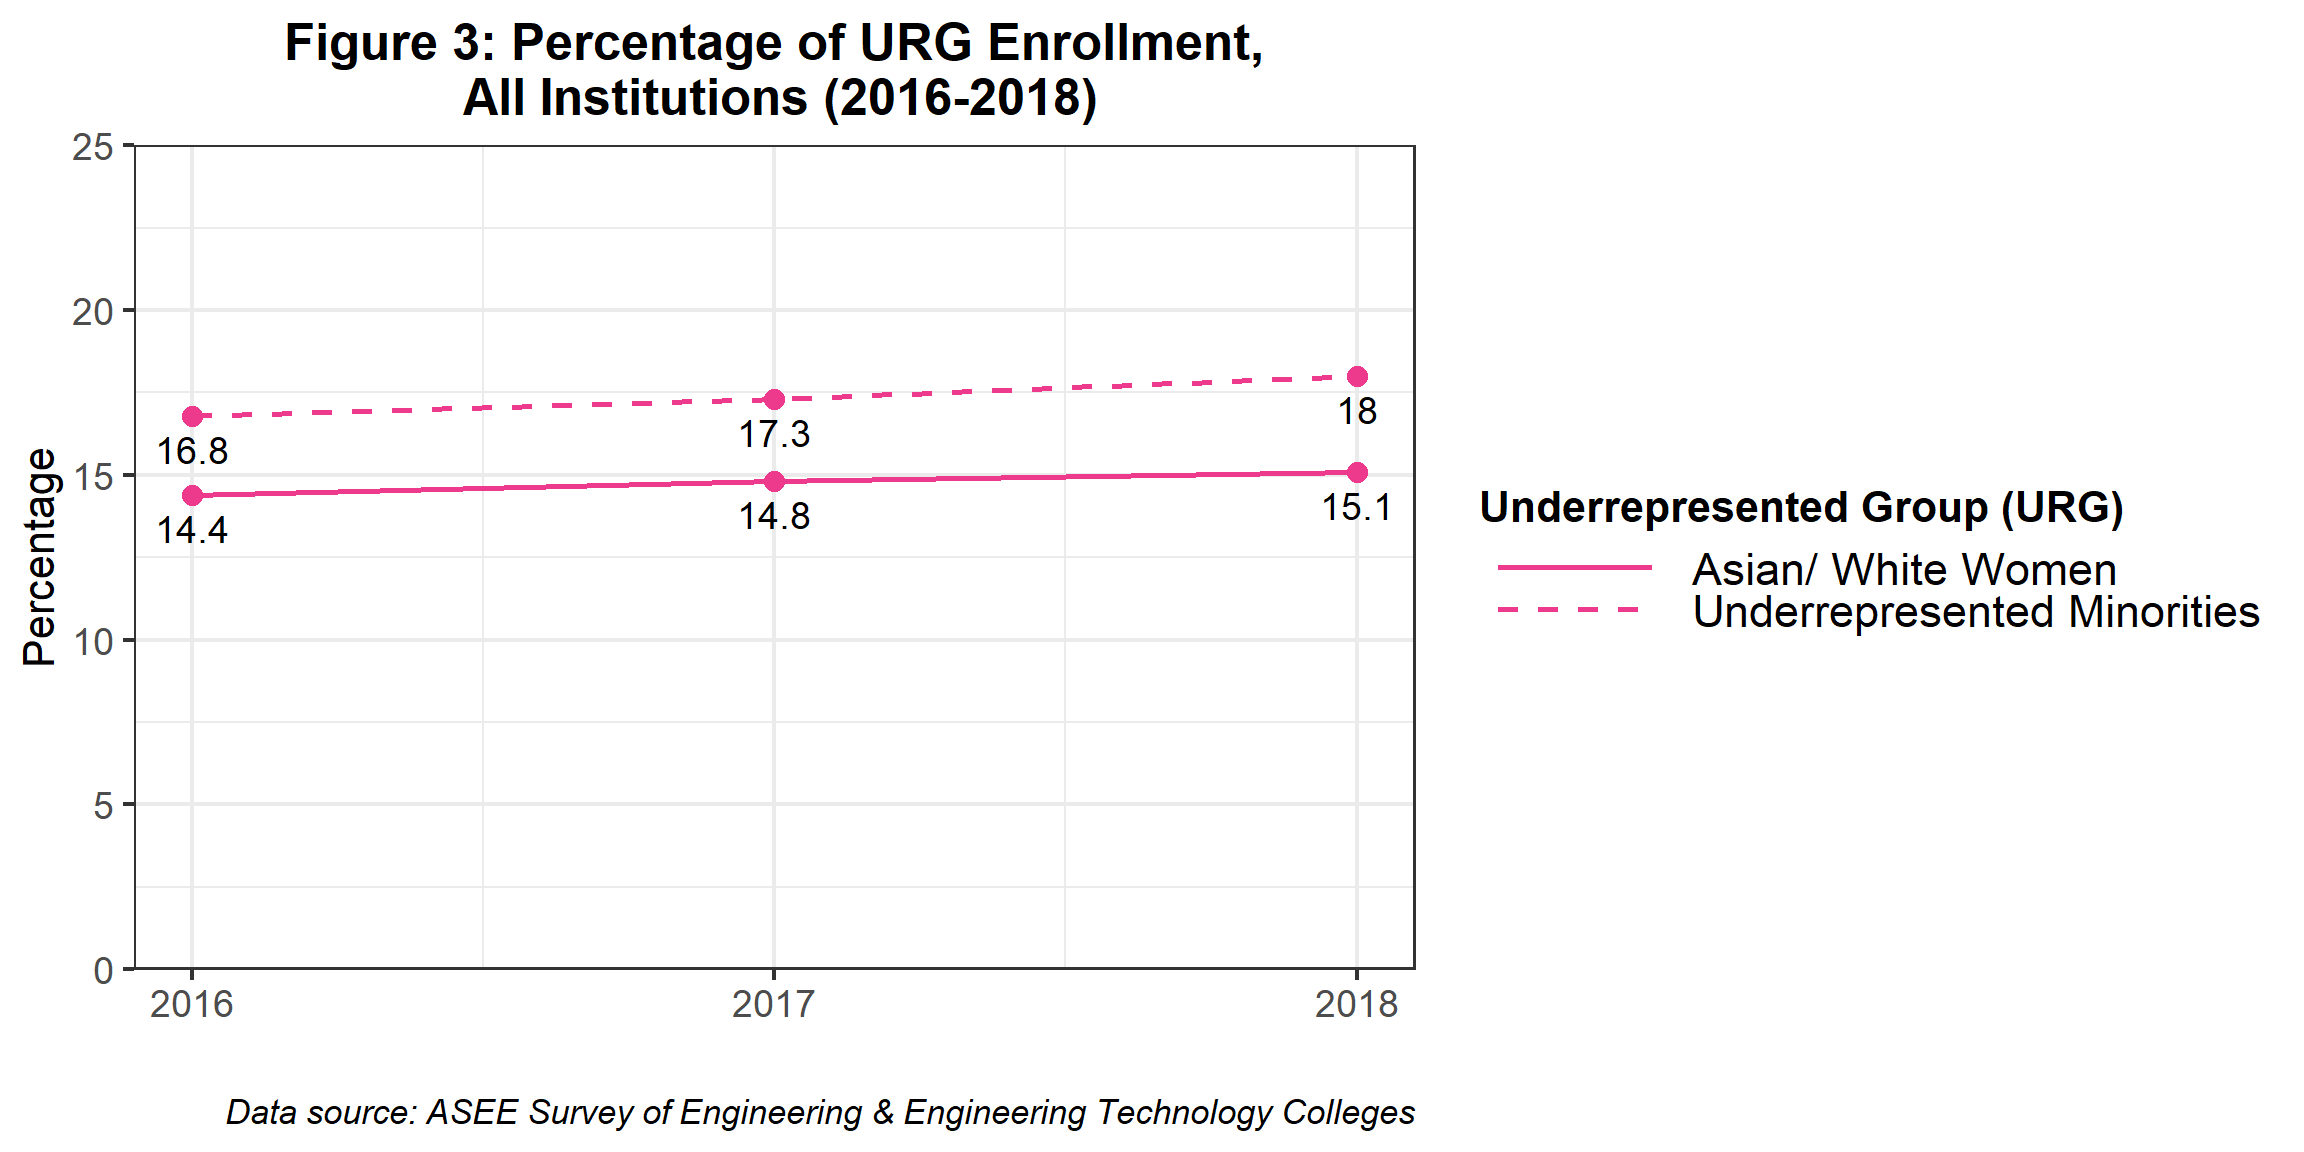
According to data submitted to the ASEE Profiles Survey from 2016 and 2018, undergraduate full-time enrollment of AWW increased from 88,813 to 93,679 and from 103,051 to 110,611 for URM. Excluding Non-Resident Aliens, there were 618,244 full-time undergraduate students enrolled in 2018. Underrepresented minorities accounted for 17.9 percent of students enrolled, while Asian women and White women accounted for 15.2 percent. As seen in Figure 3, URM and AWW enrollment increased by 1.1 percent and 0.7 percent, respectively, compared to 2016.
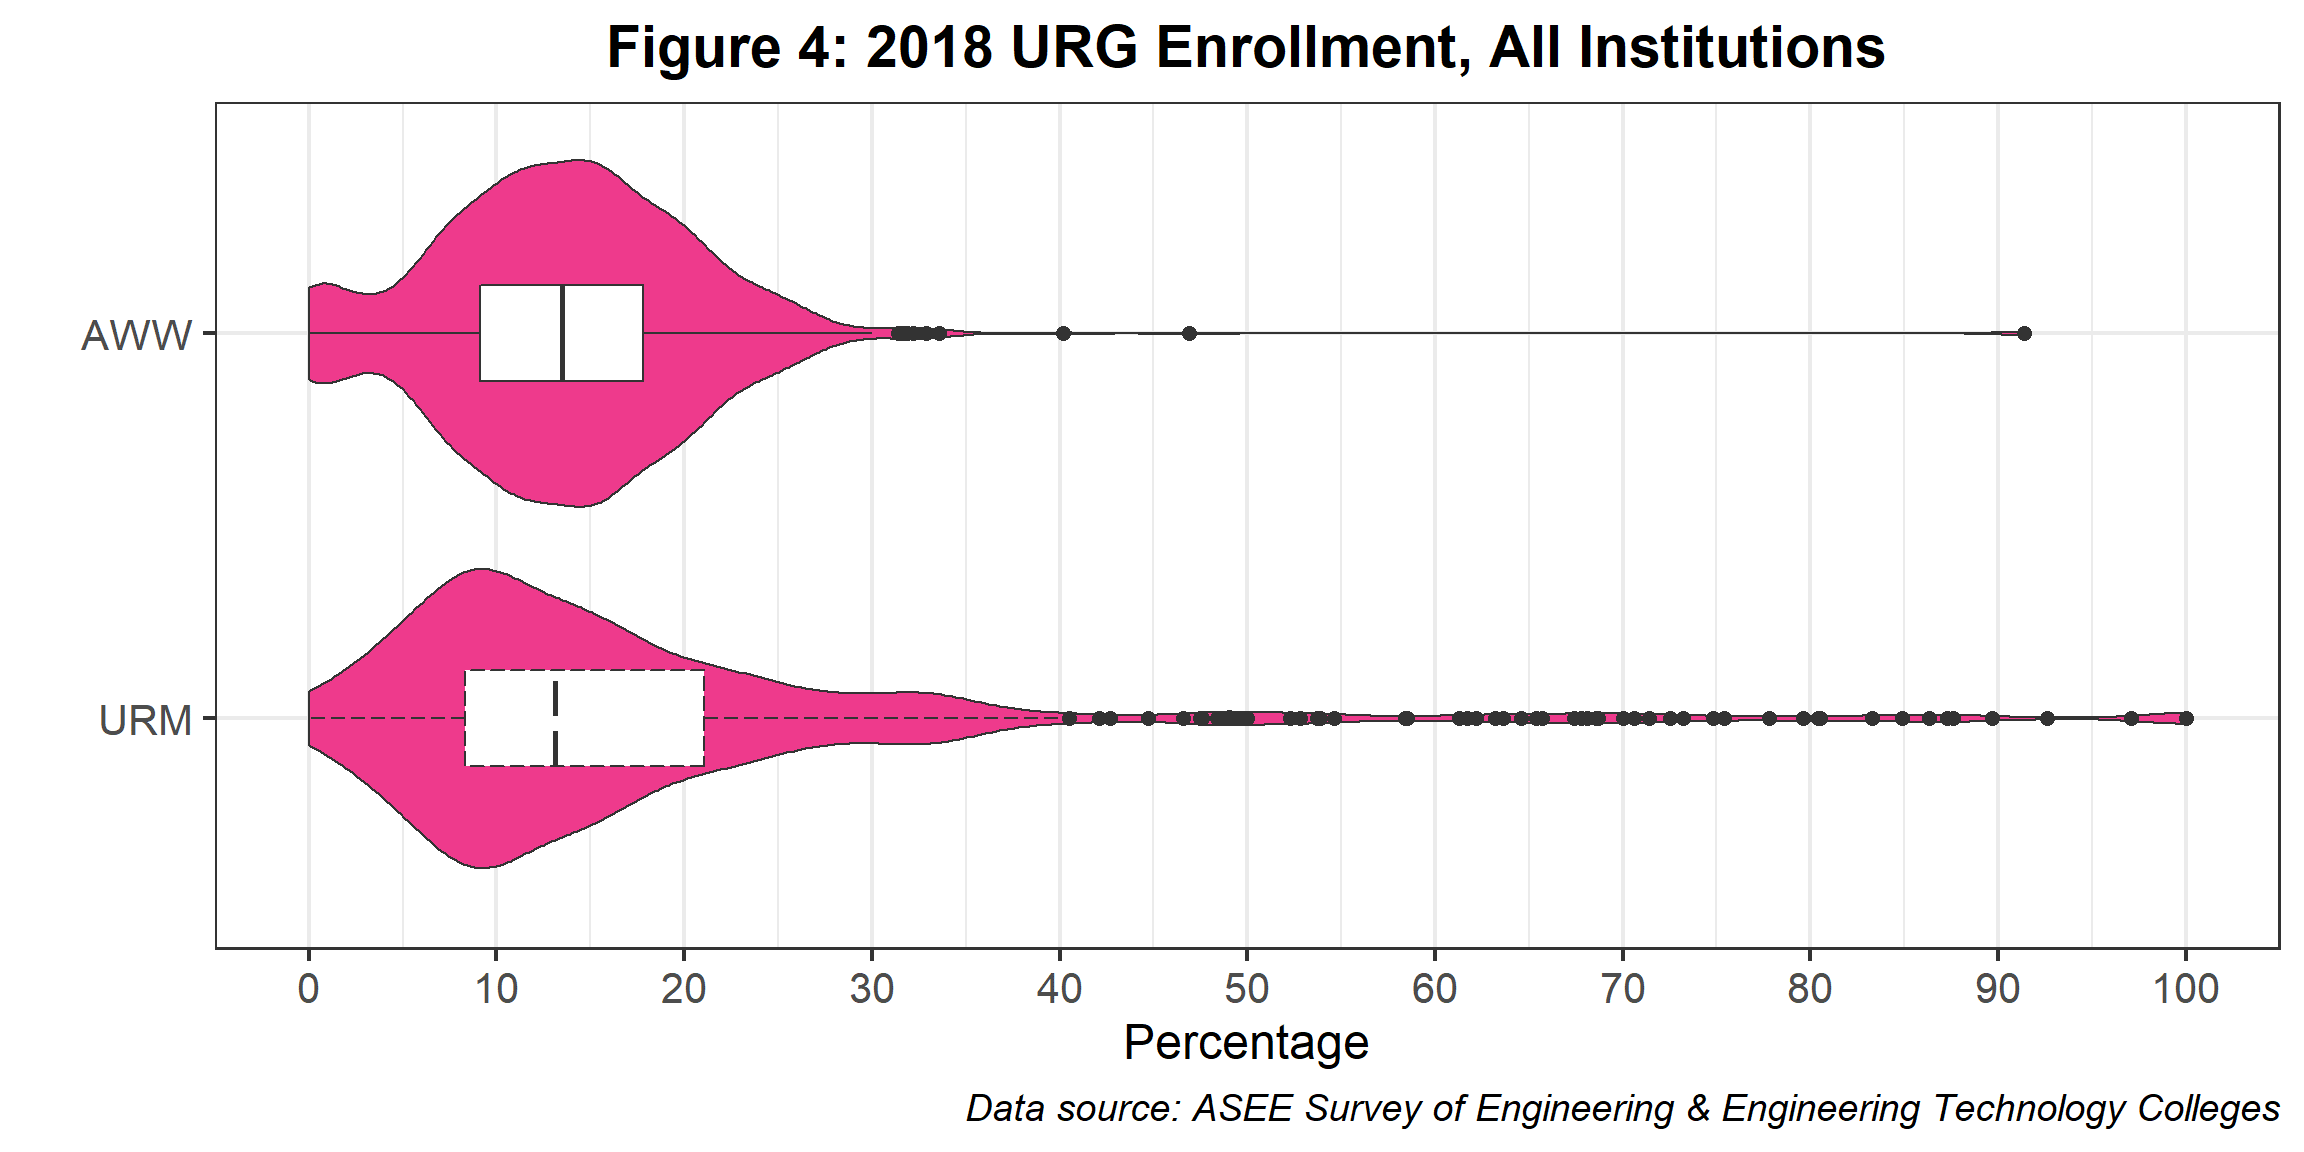
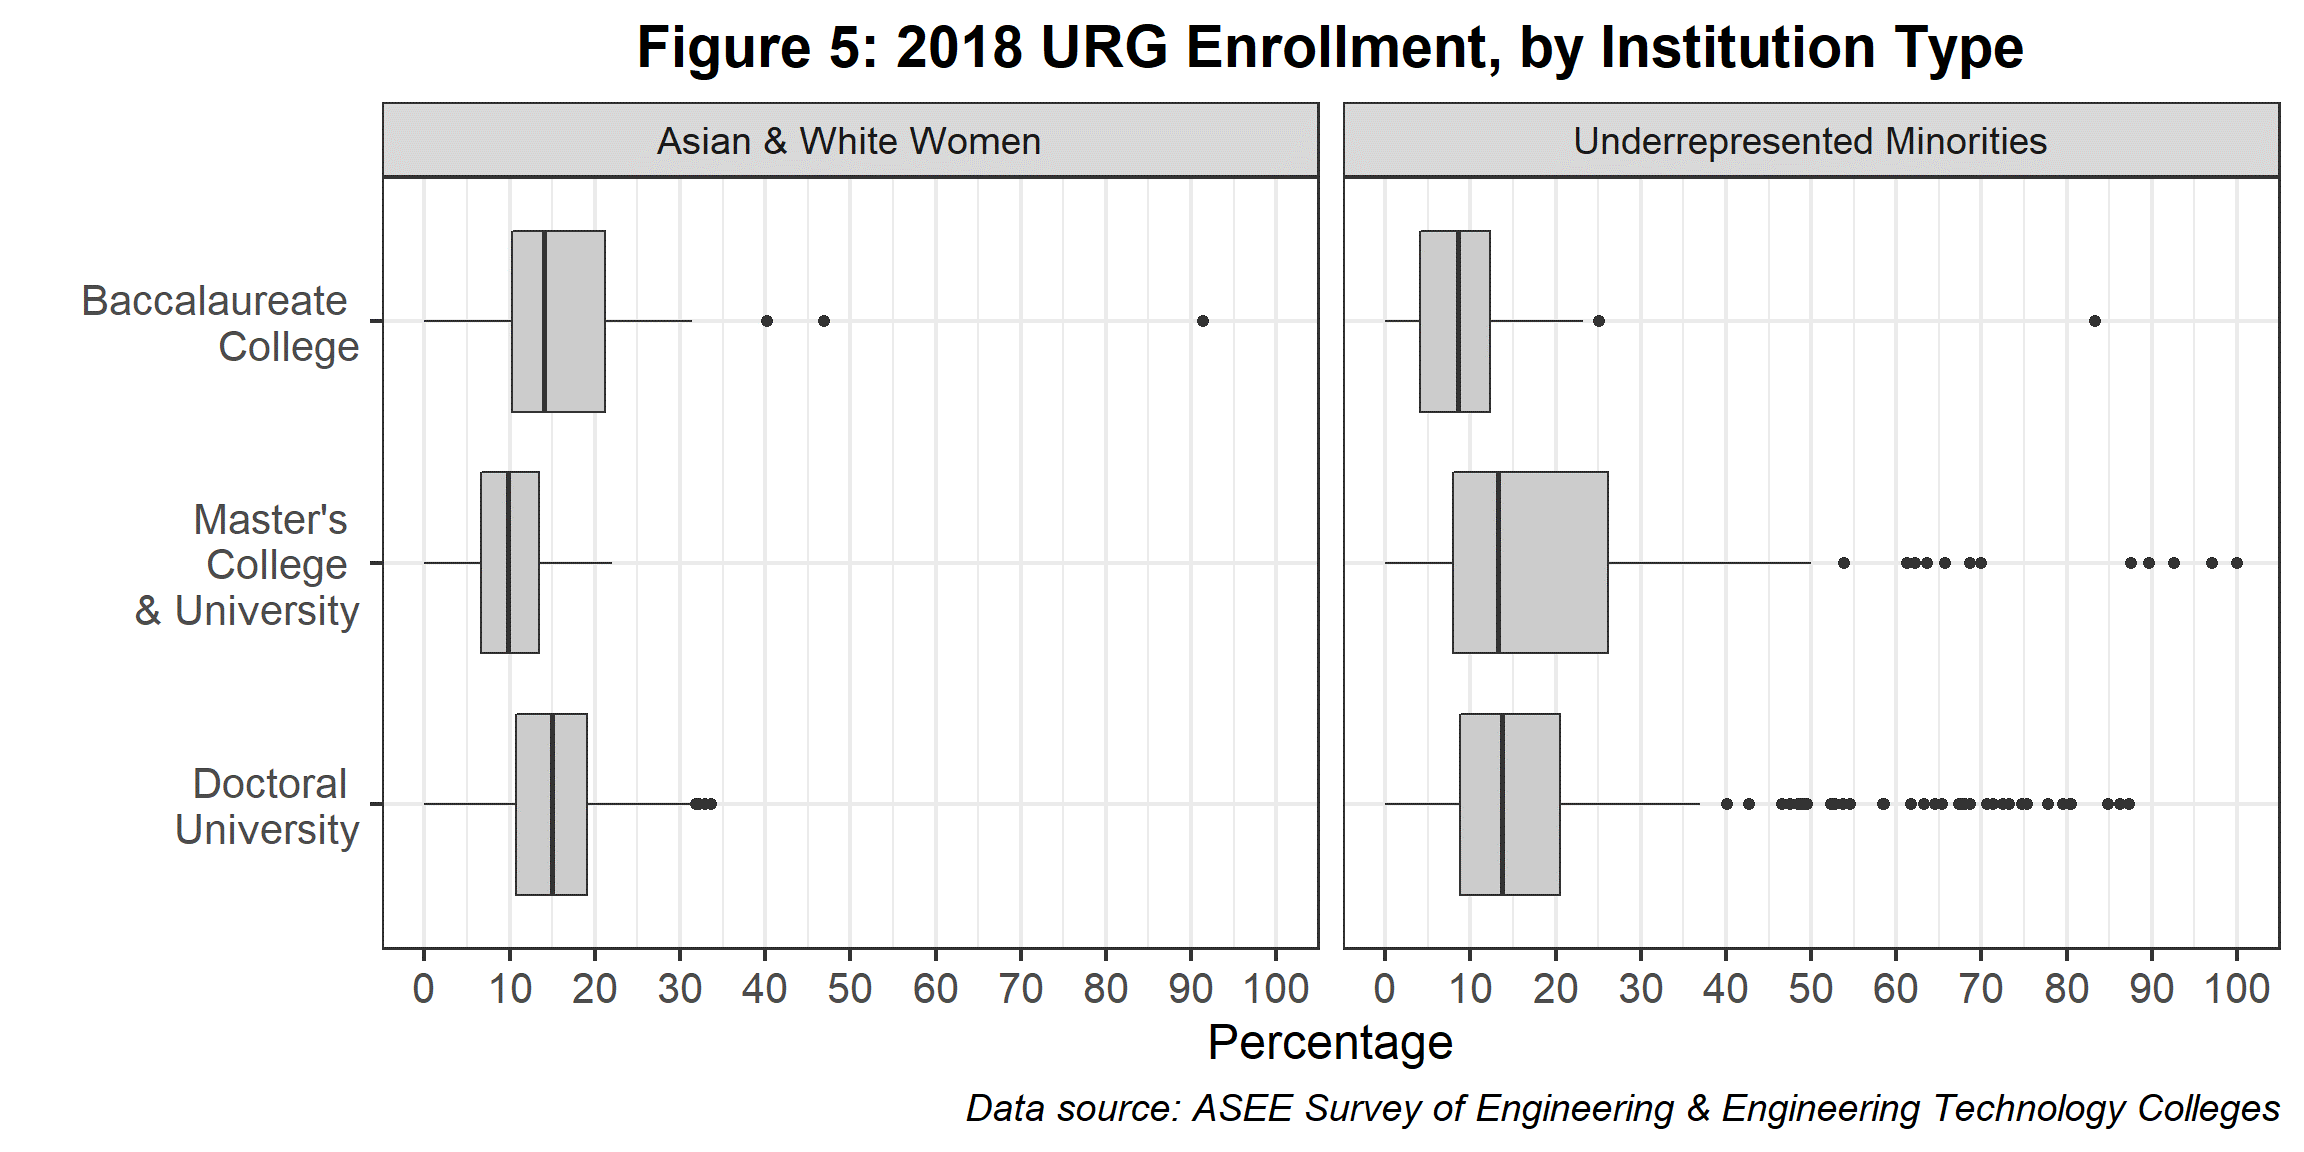
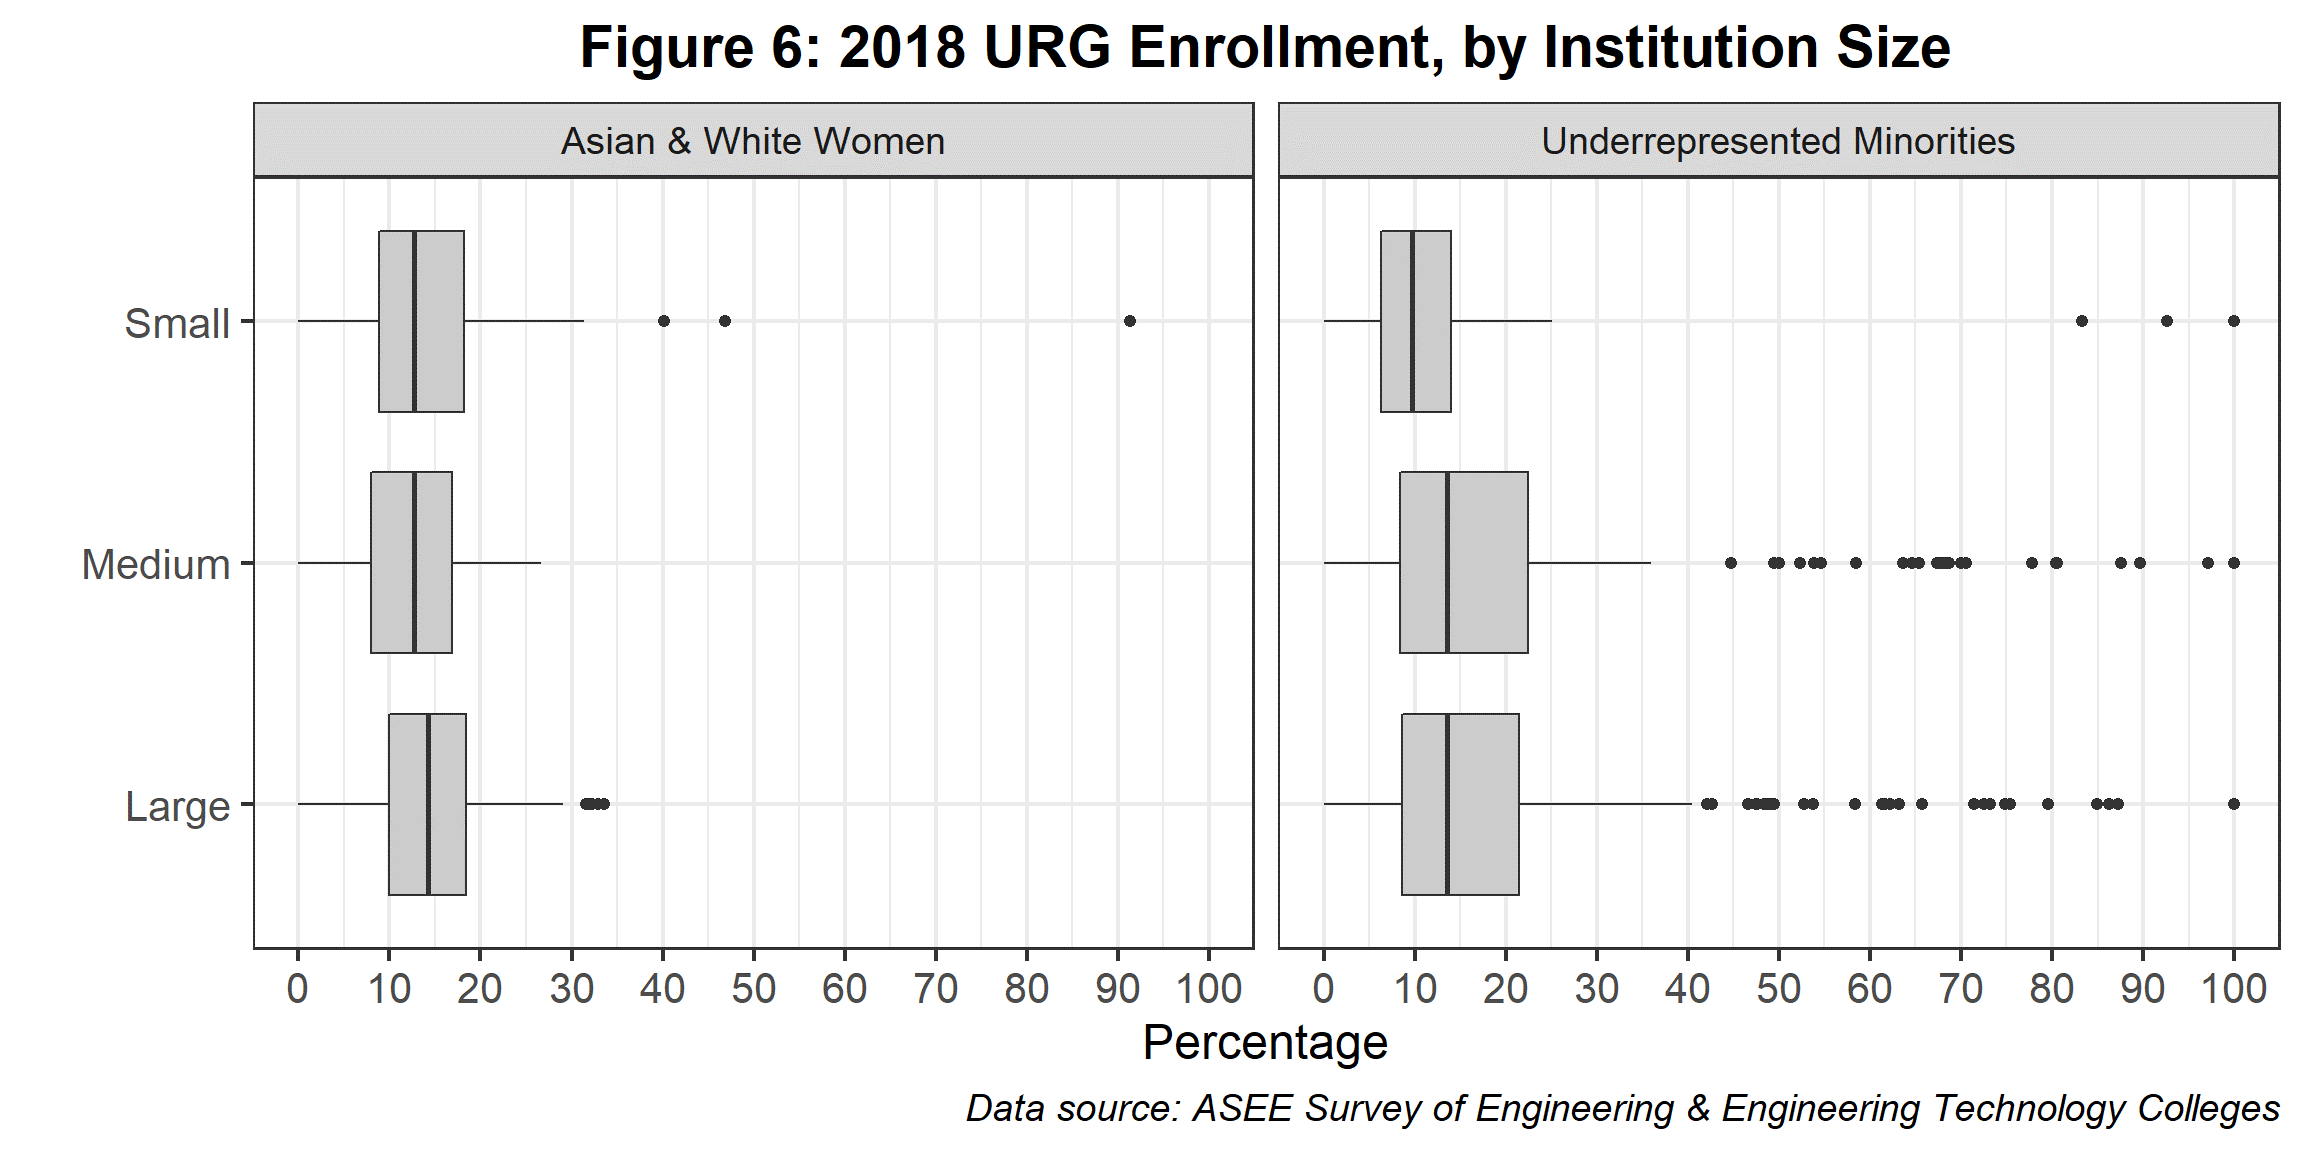
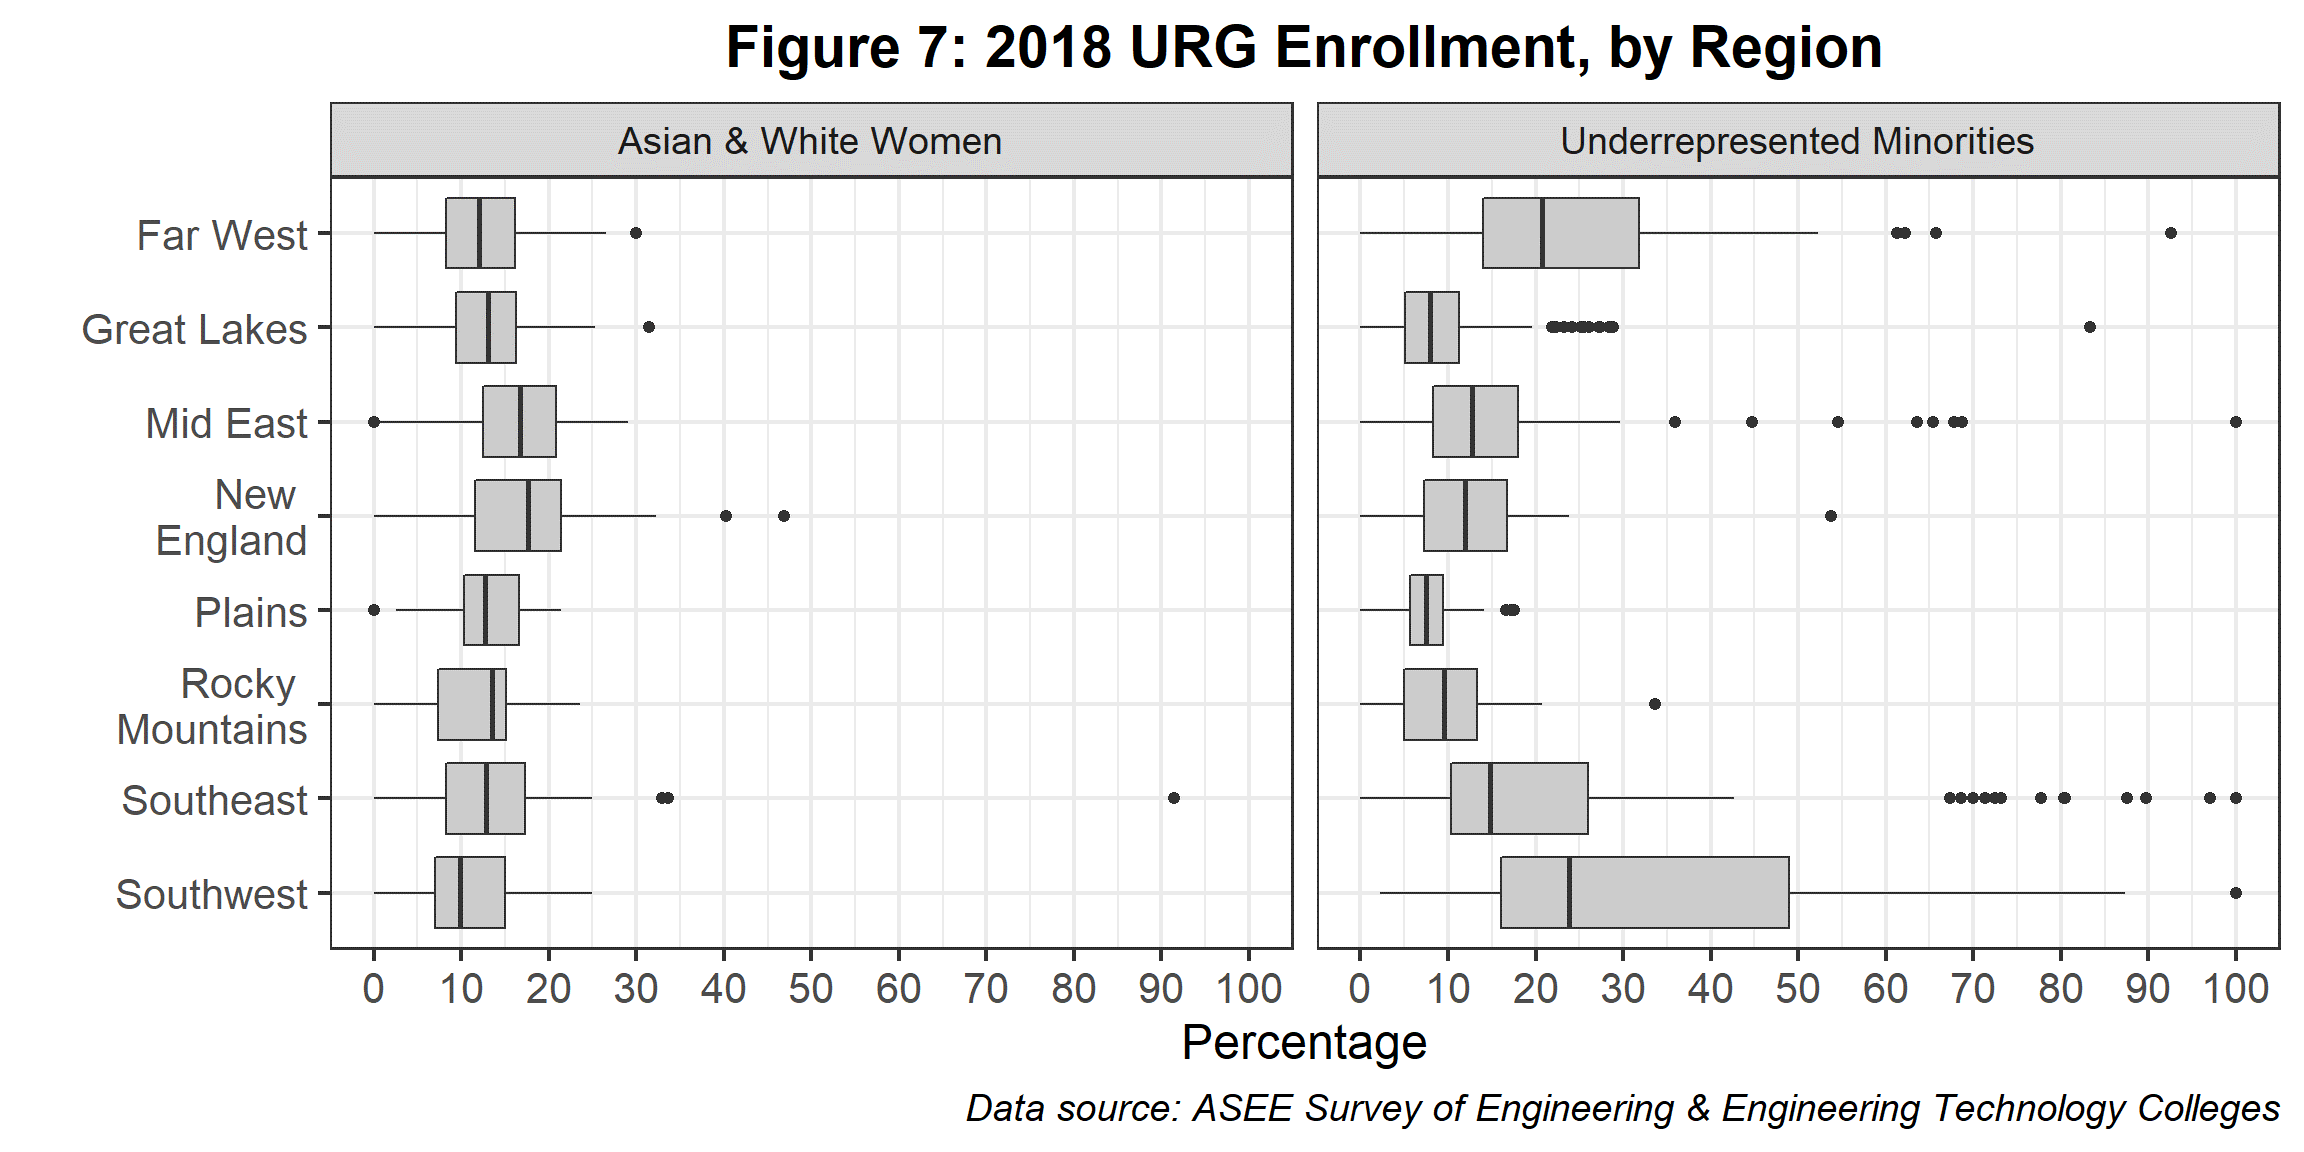
In 2018, the median percentage of URG for all institutions was 13.1 percent for URM and 13.5 percent for AWW (Figure 4). While the breakdown by institution type and size are similar, there is more variance in the regional breakdown (Figures 5-7).
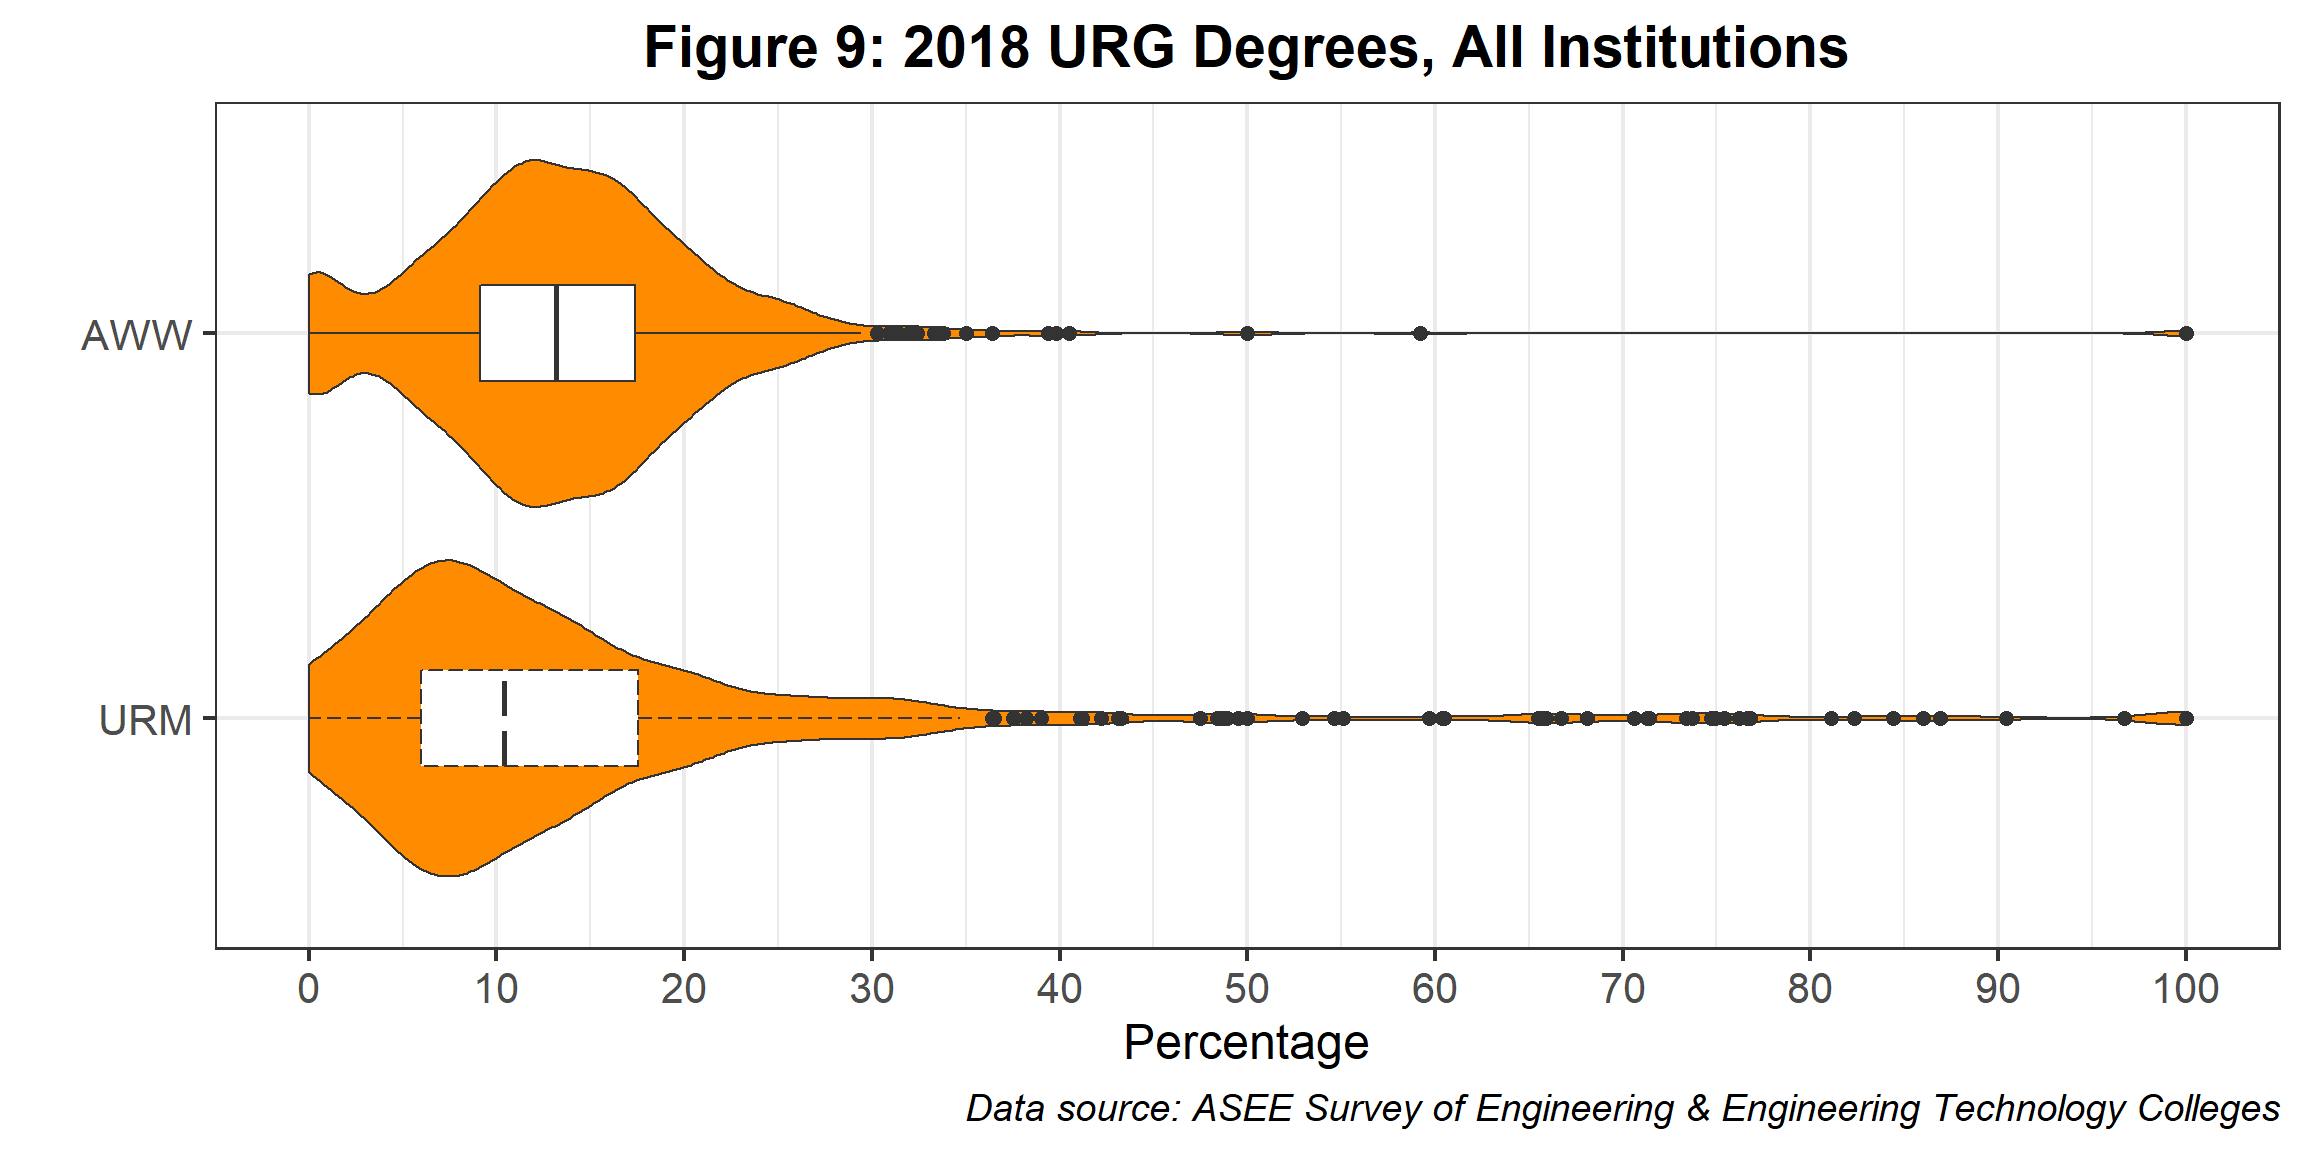
Undergraduate Degrees
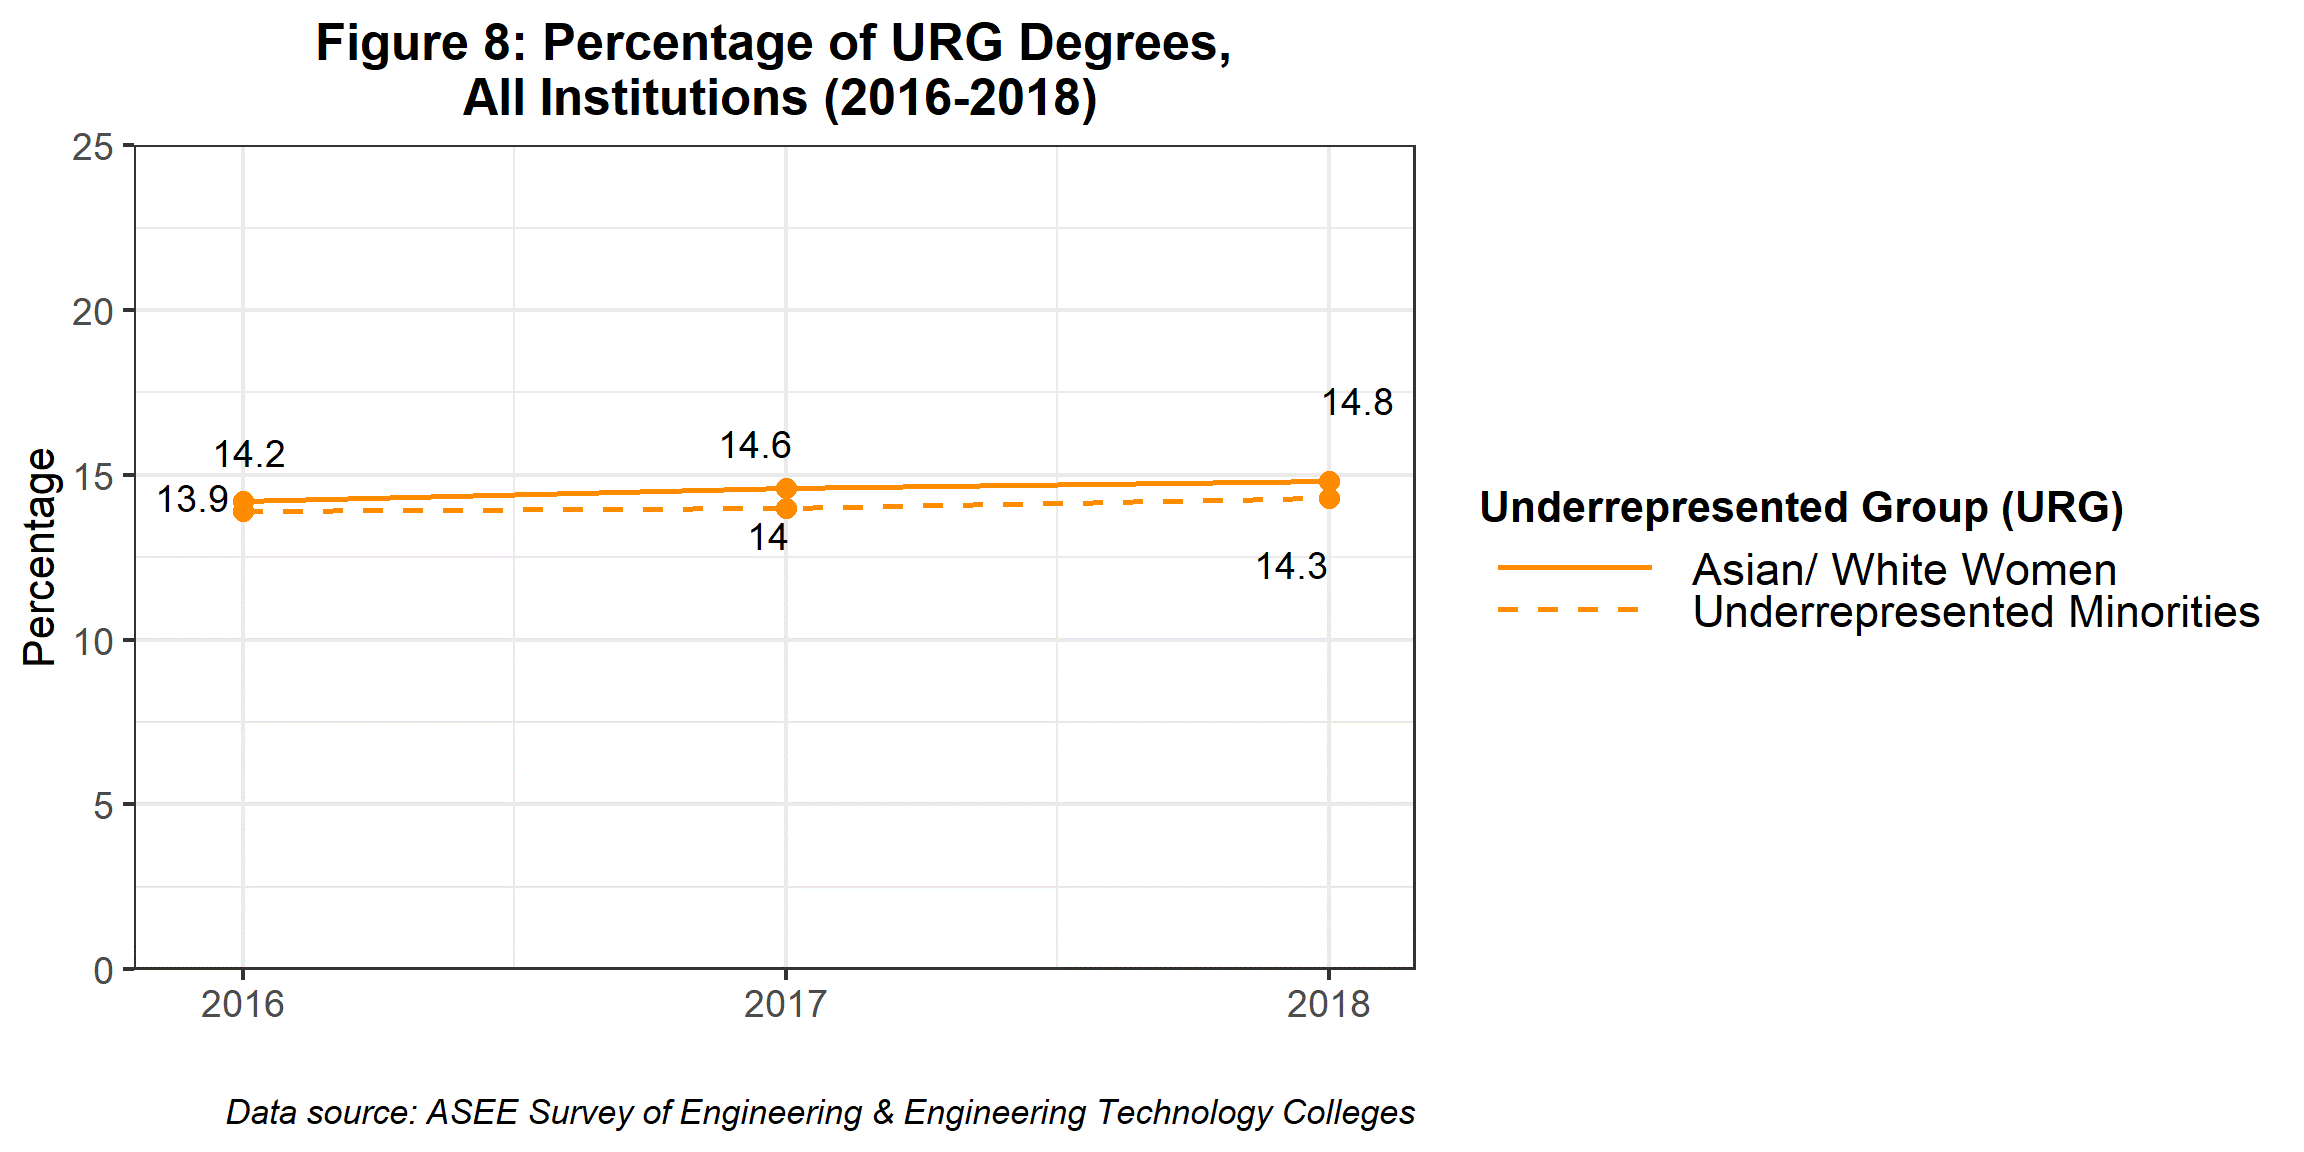
From 2016 and 2018, undergraduate degrees awarded to AWW increased from 16,254 to 19,435 and from 15,946 to 18,674 for URM. Excluding Non-Resident Aliens, there were 130,947 undergraduate degrees awarded in 2018. Underrepresented minorities accounted for 14.3 percent of bachelor’s degrees attained, while Asian women and White women accounted for 14.8 percent. As seen in Figure 8, the percentage of bachelor’s degrees awarded to URM and AWW enrollment increased by 0.4 percent and 0.6 percent, respectively, compared to 2016.
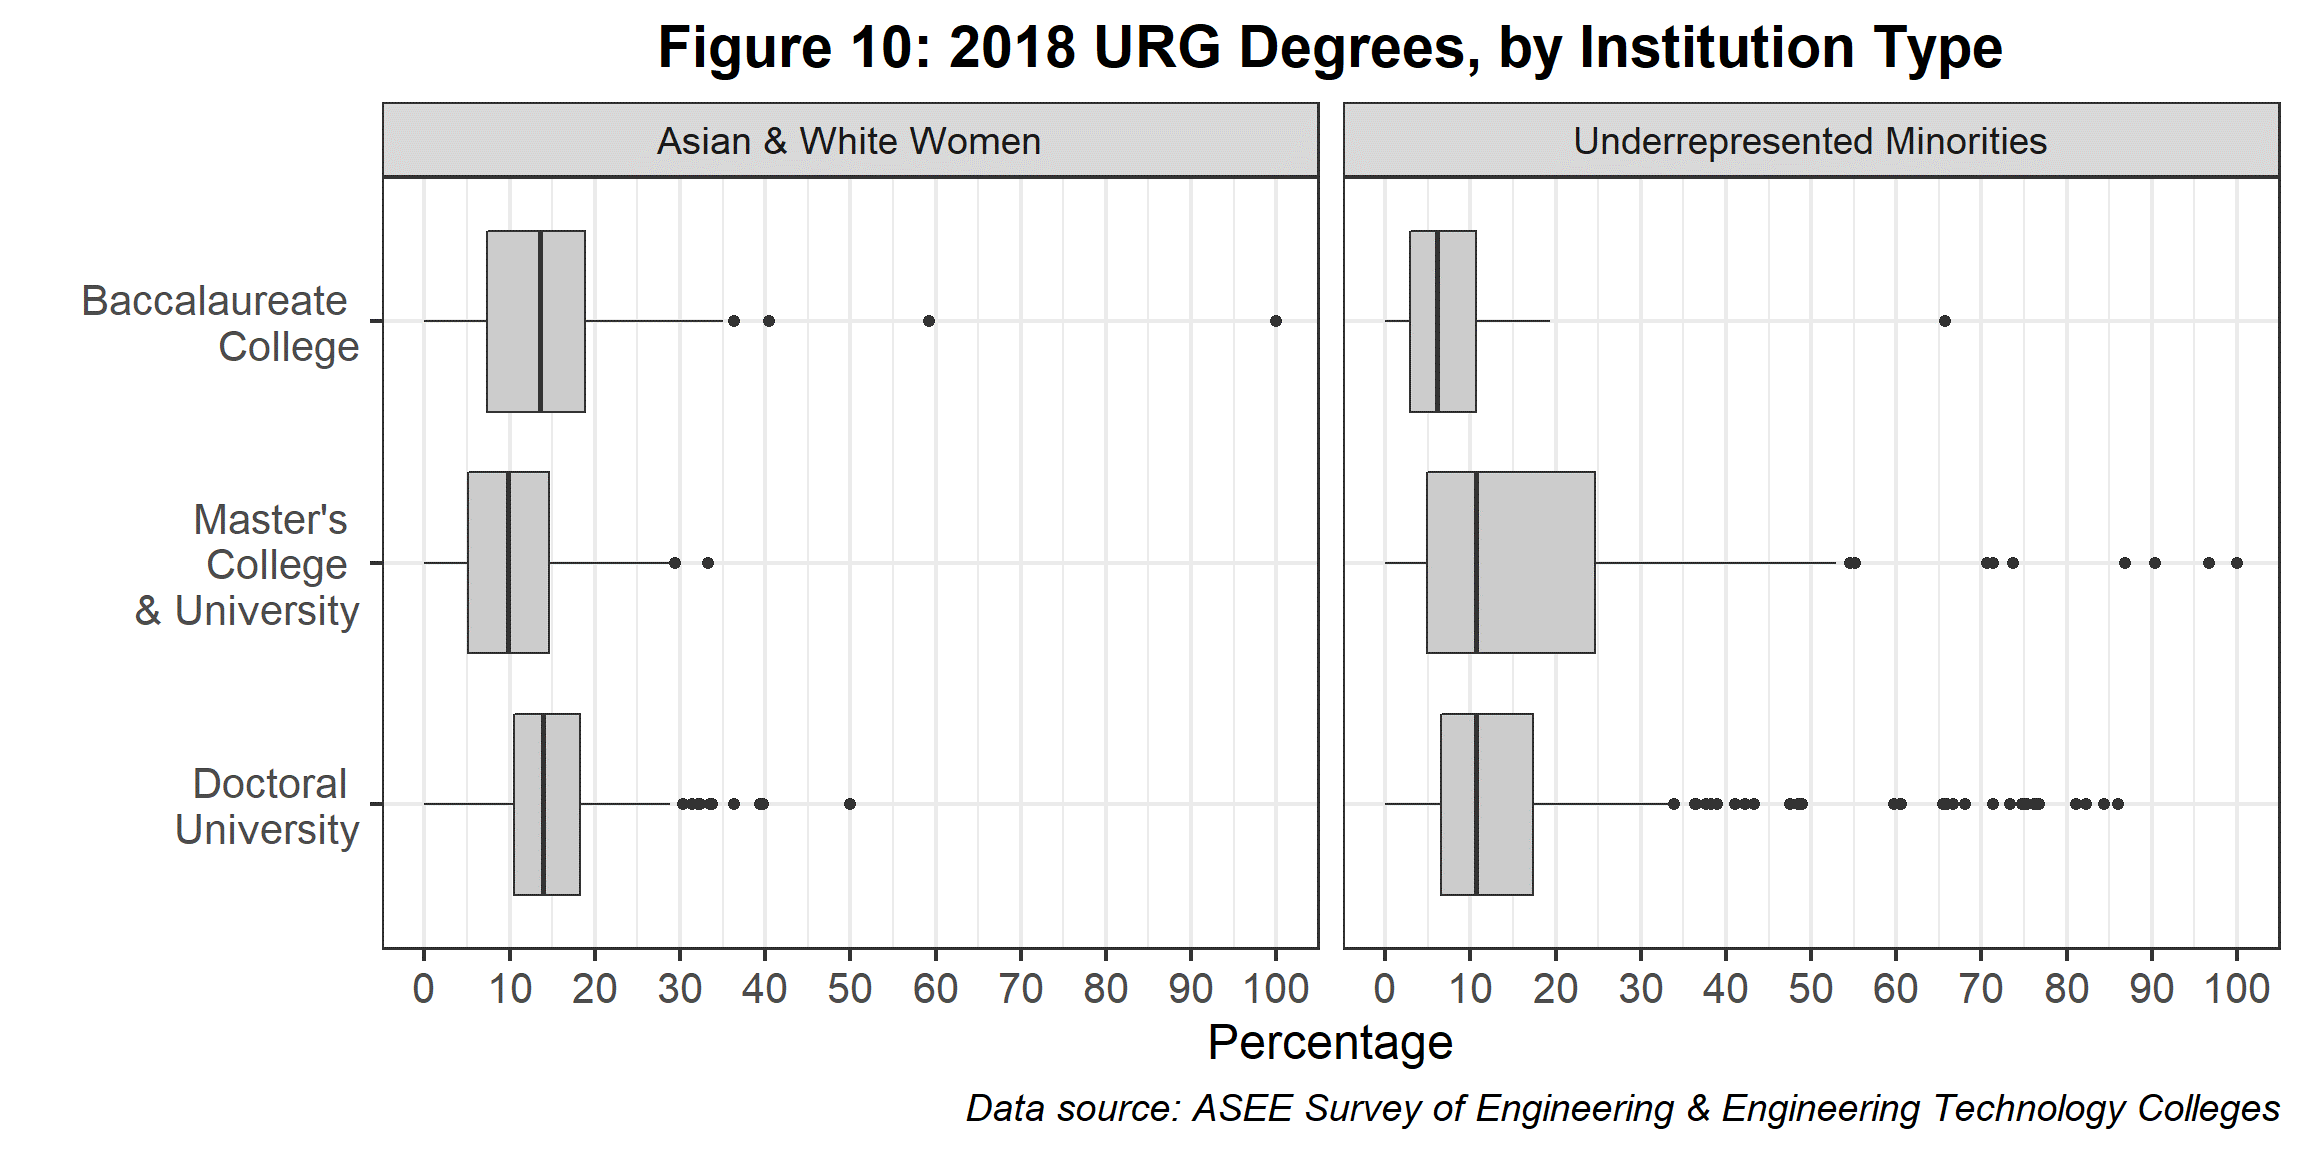
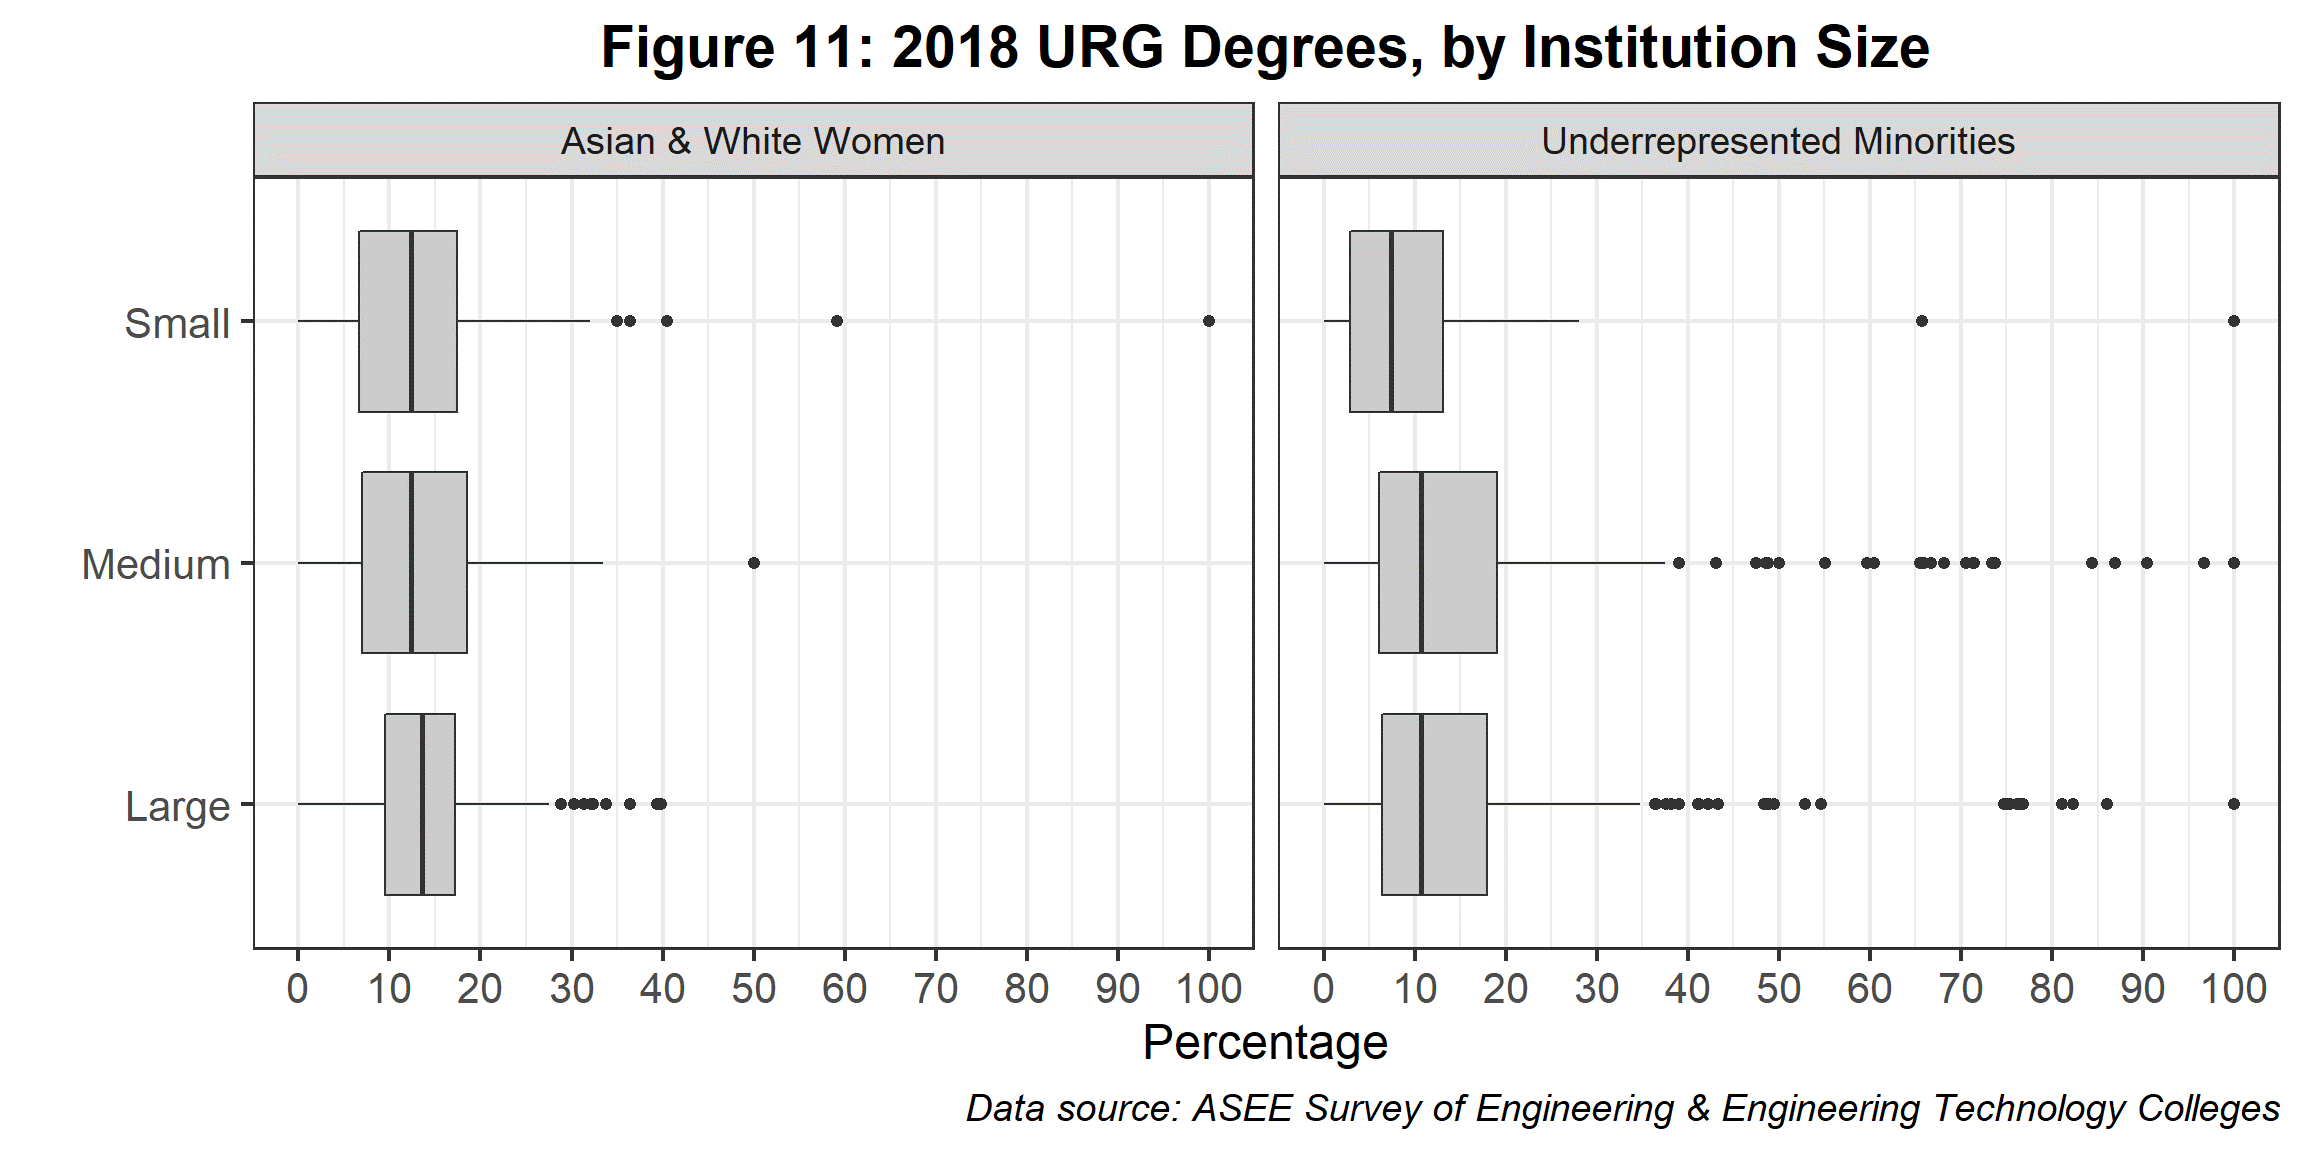
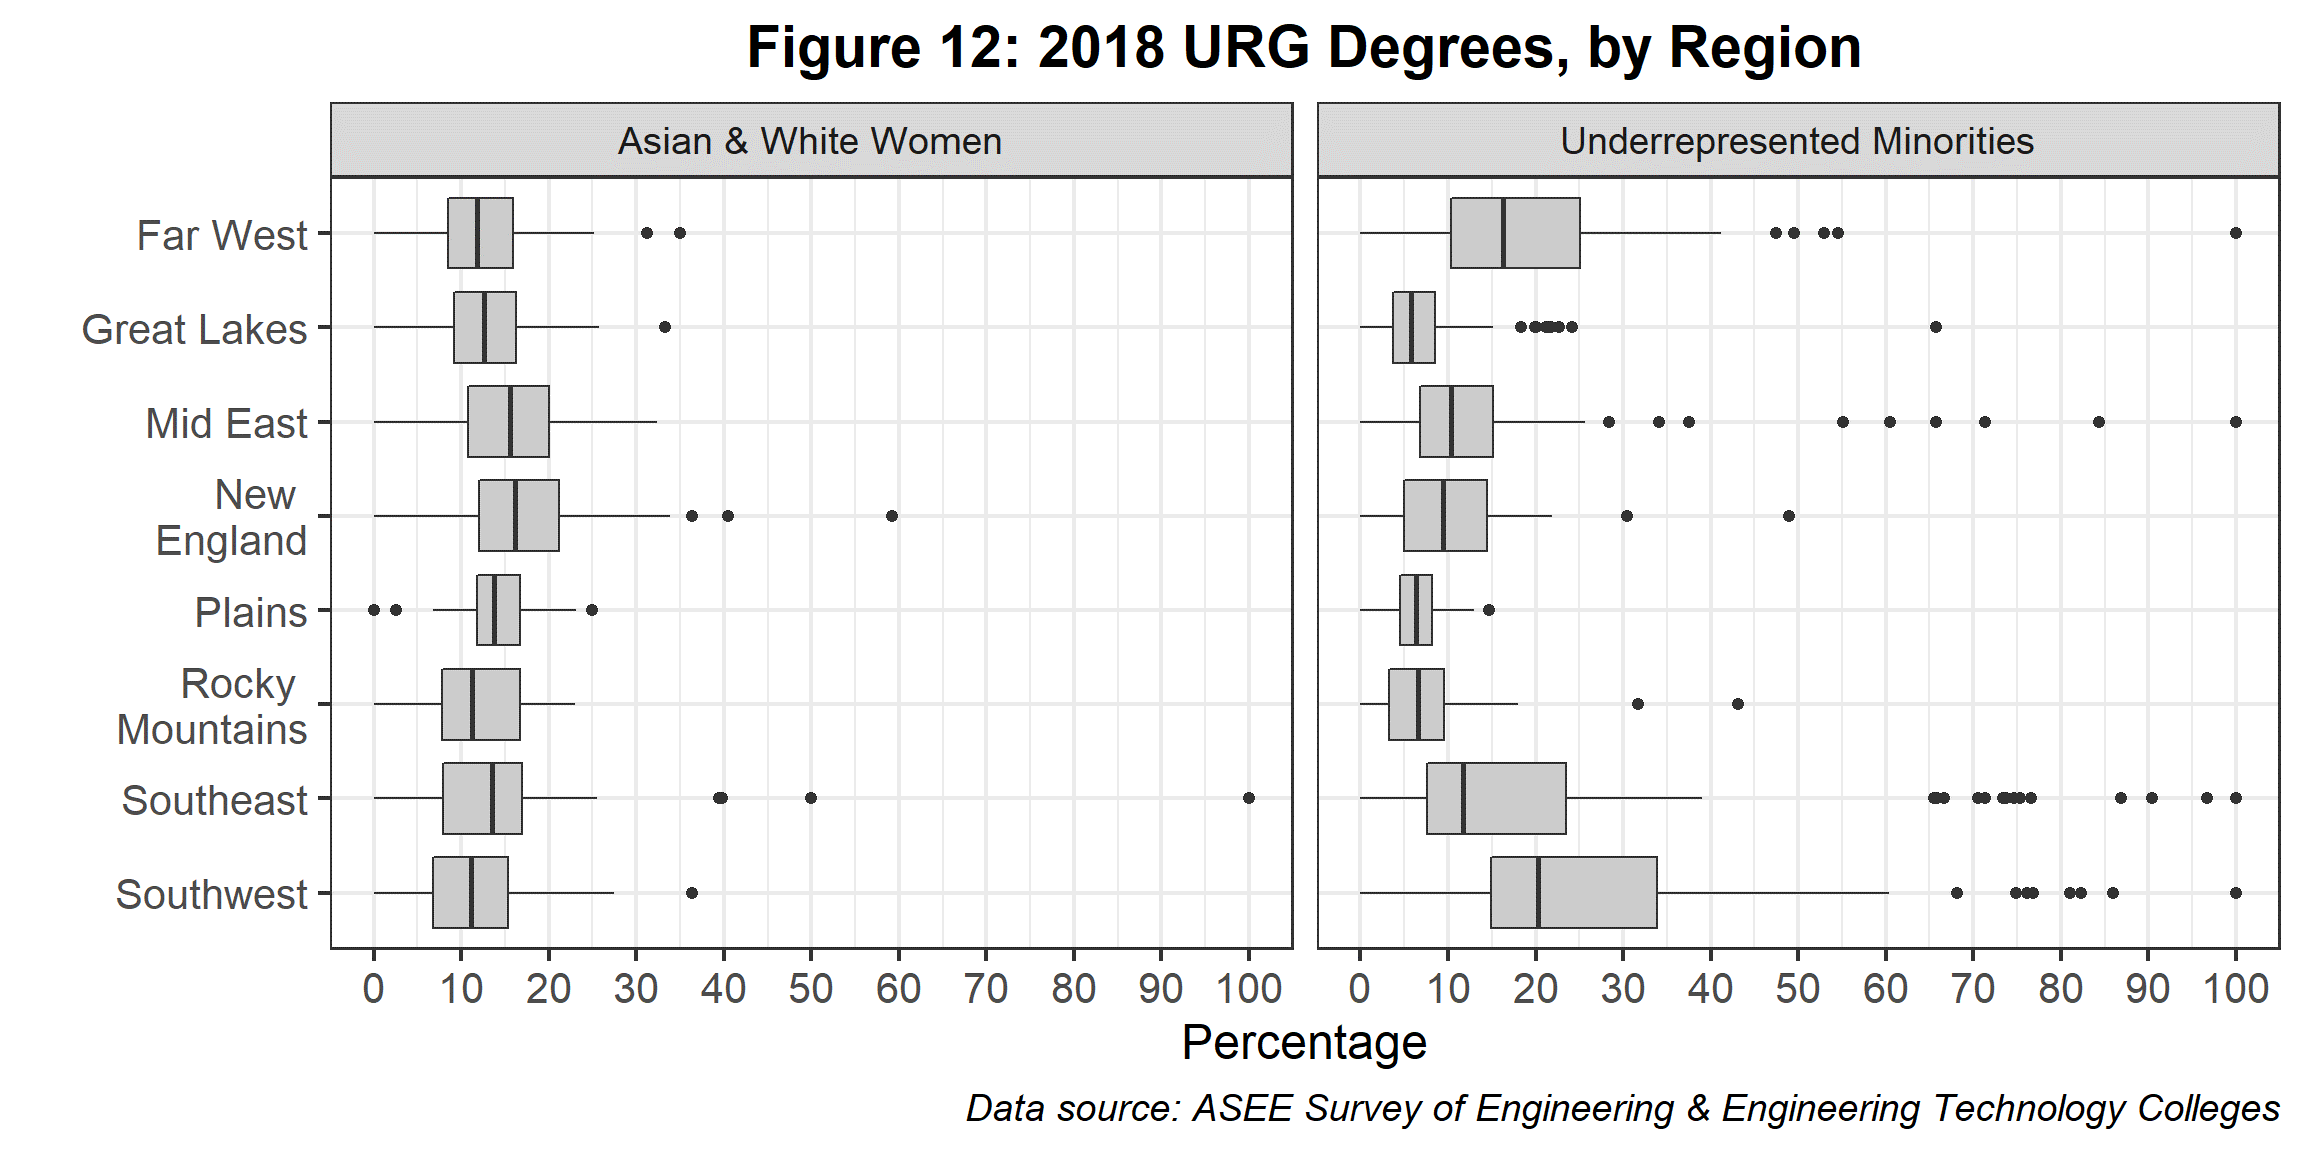
The median percentage of degrees awarded for all institutions in 2018 was 13.5 % for AWW and 13.1 % for URM (Figure 9). Figures 10-12 show the breakdown by institution type, size, and region
Faculty
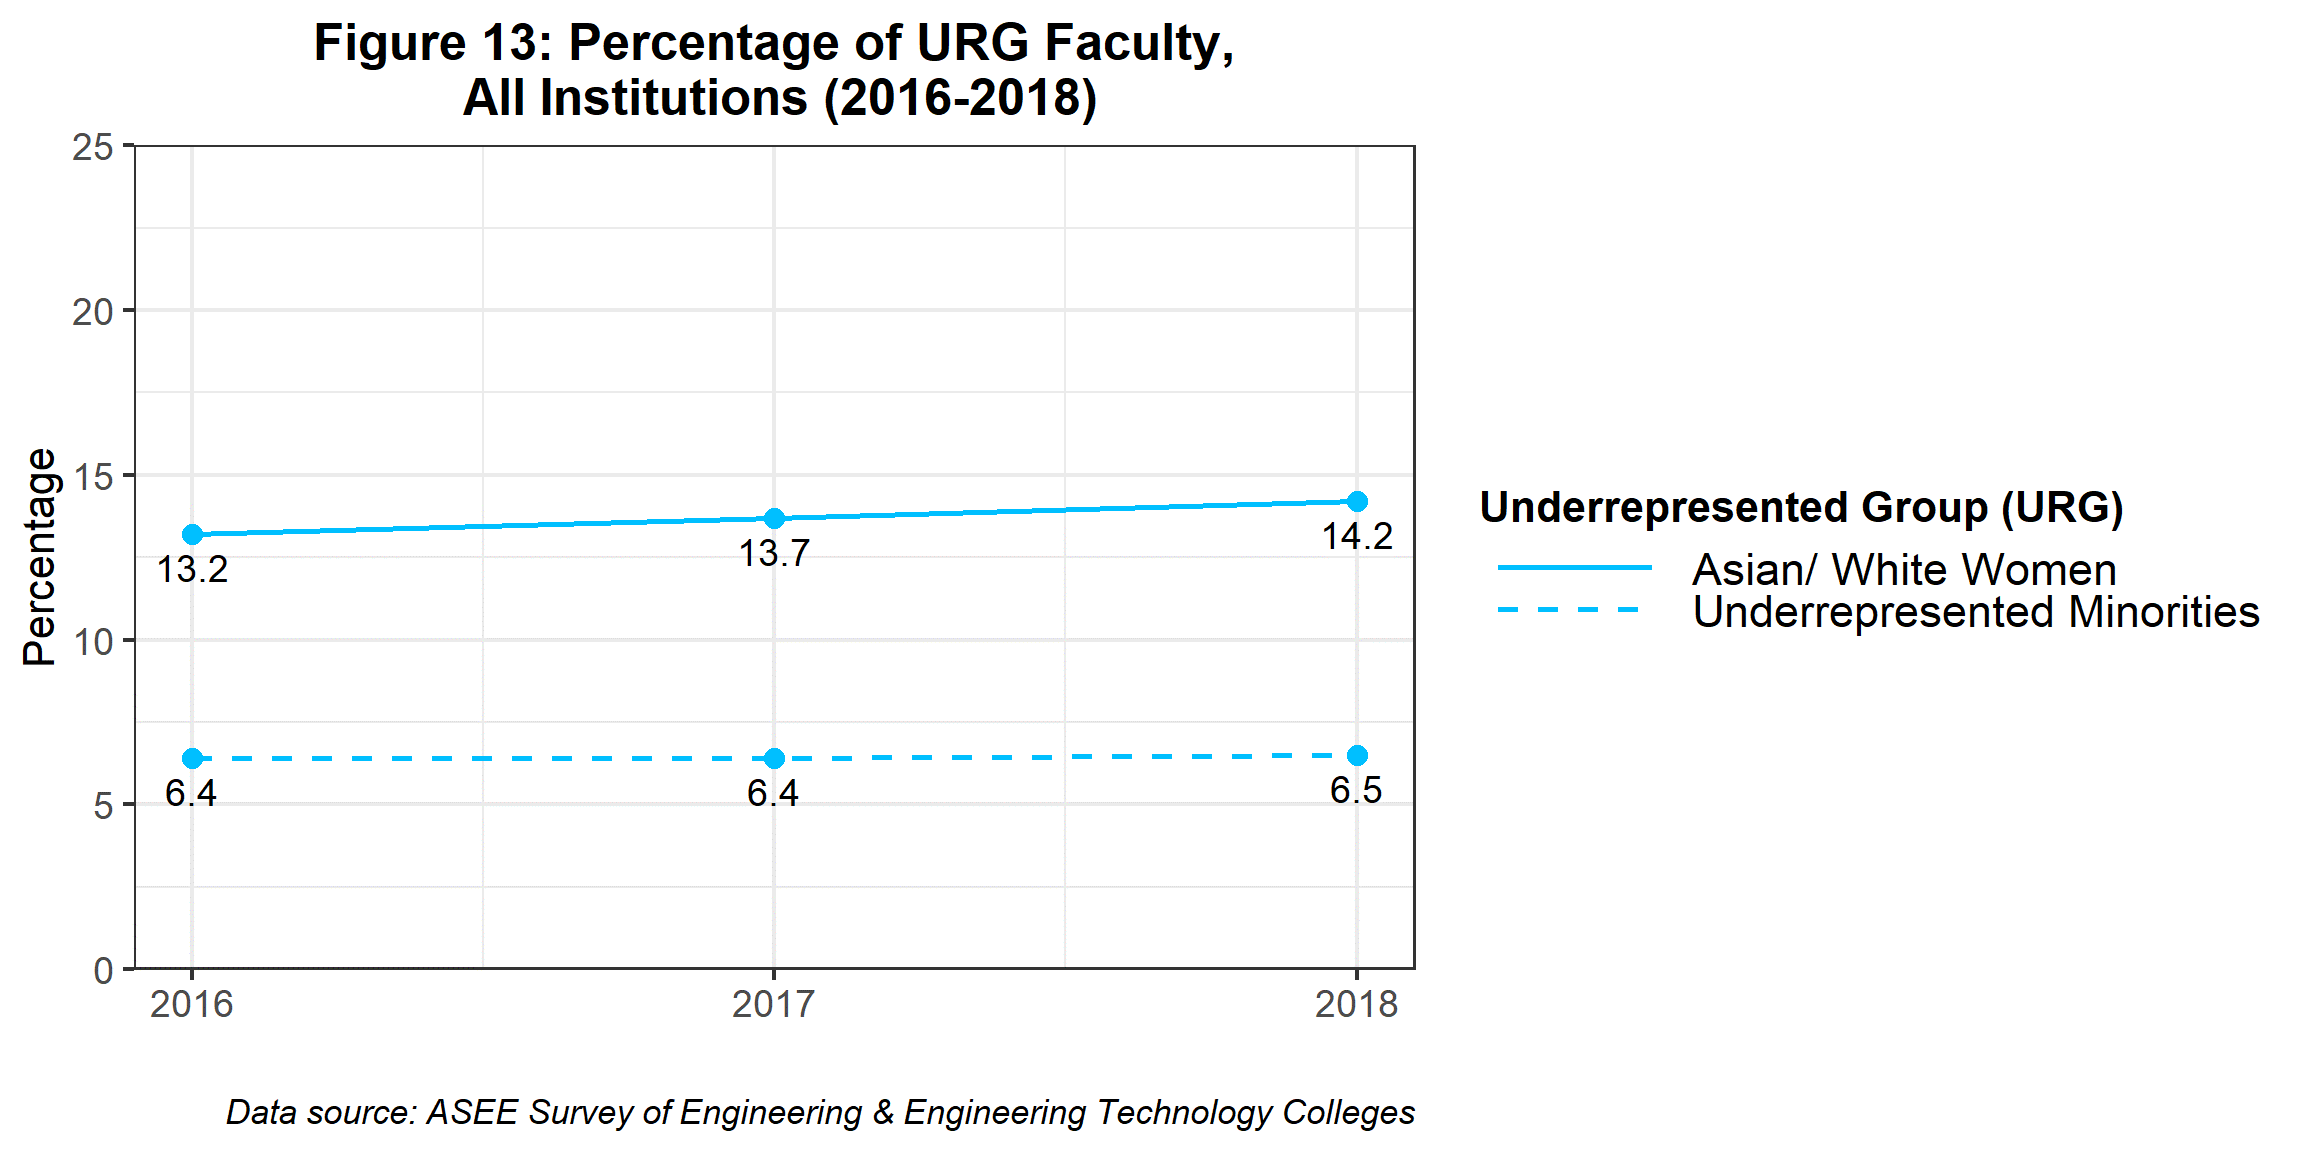
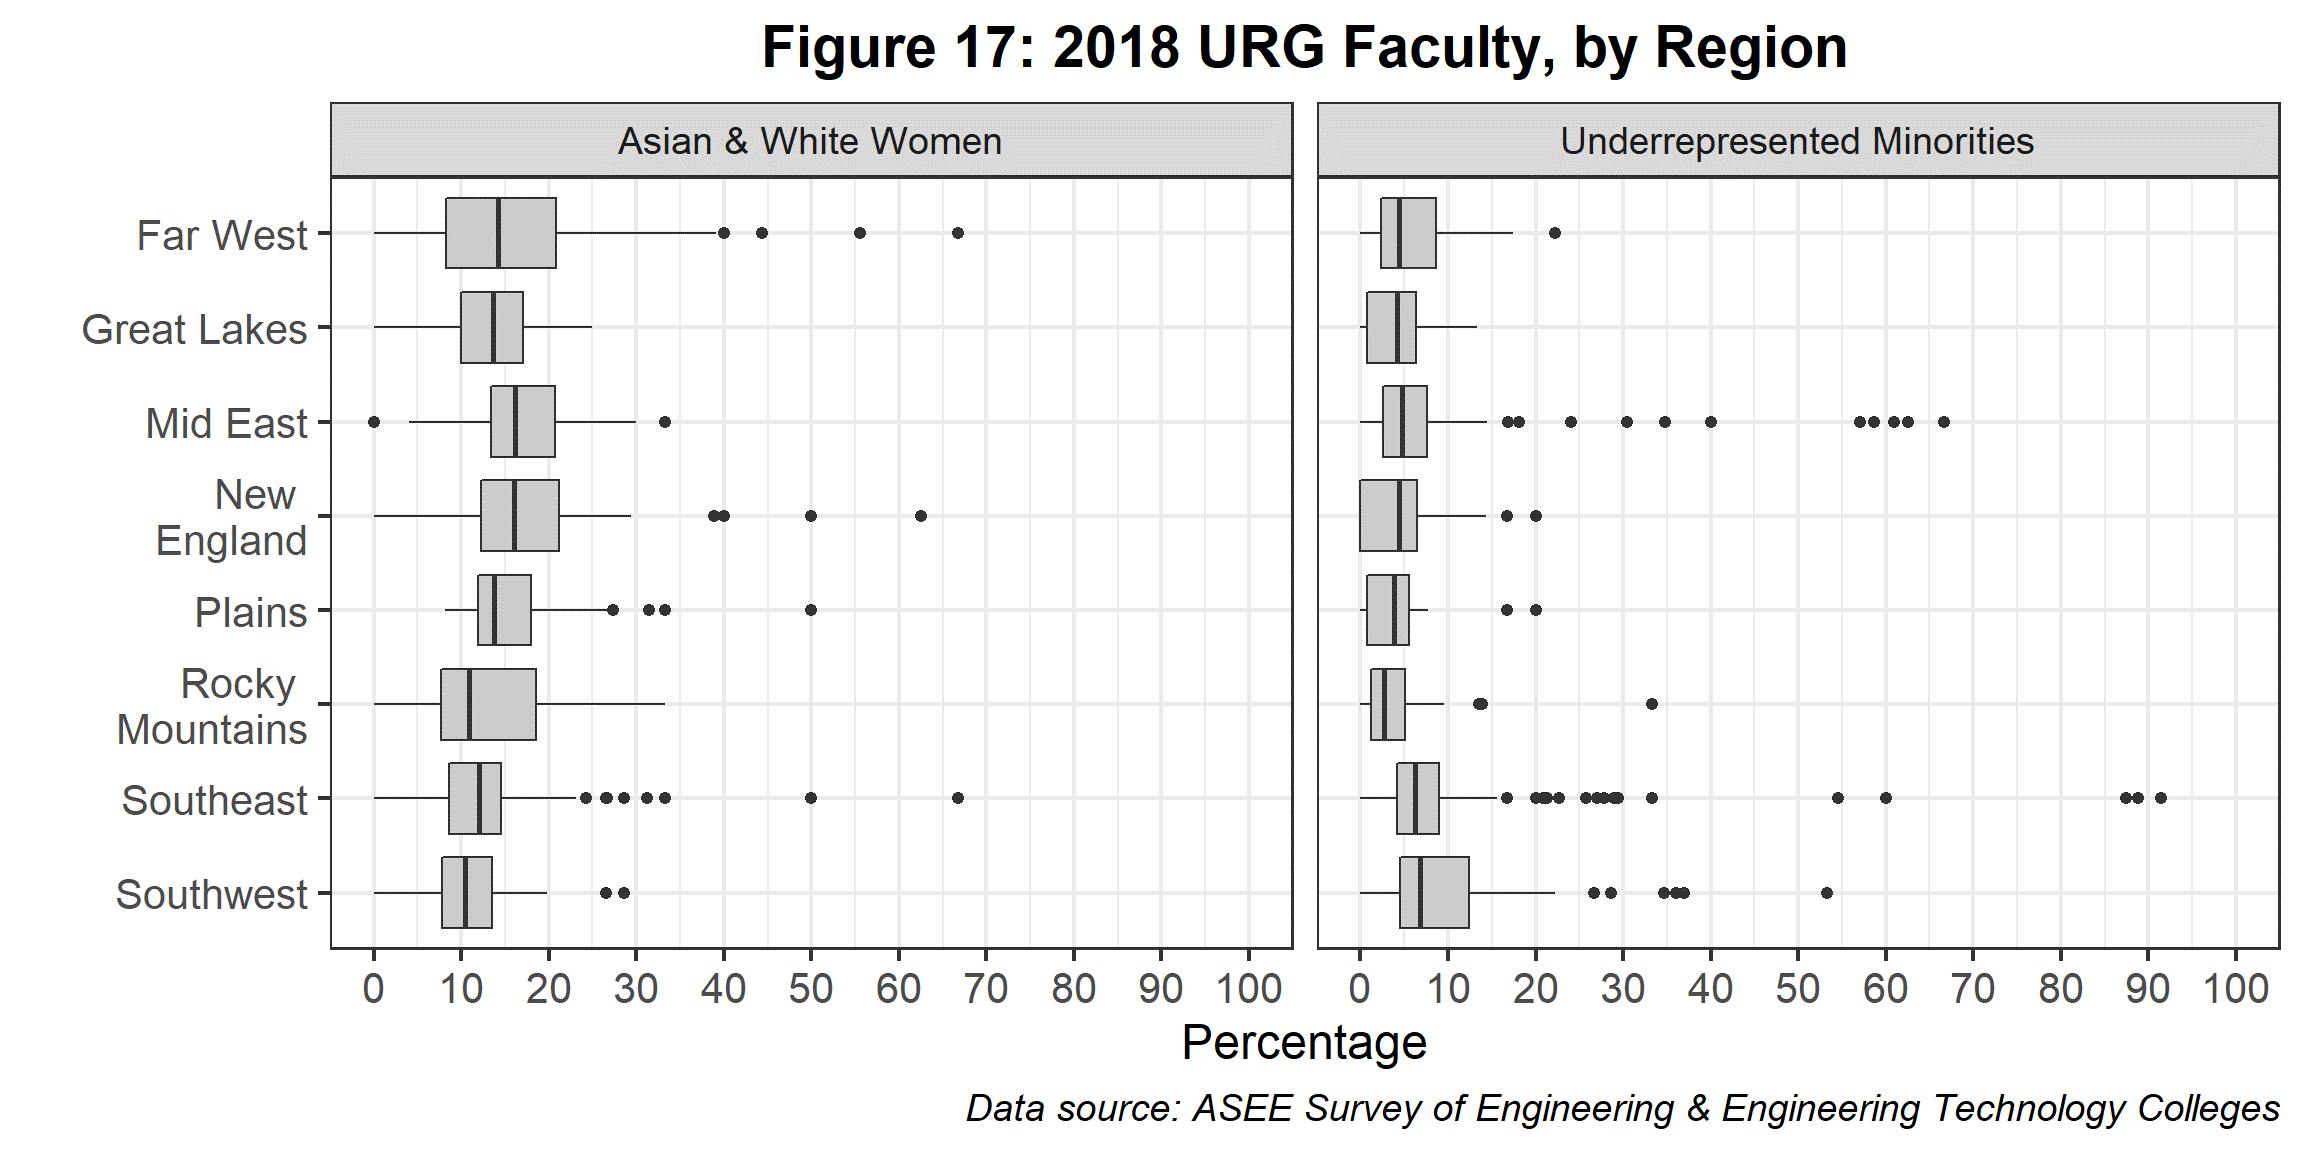
From 2016 and 2018, full-time tenure-track faculty increased from 3,643 to 3,872 for AWW and from 1,829 to 1,762 for URM. Excluding Non-Resident Aliens, there were 27,088 full-time tenure-track faculty in 2018. Underrepresented minorities accounted for 6.5 percent of faculty, while Asian women and White women accounted for 14.3 percent. As seen in Figure 13, the percentage of faculty for URM decreased by 0.1 percent, whereas AWW increased by 1.1 percent, compared to 2016.
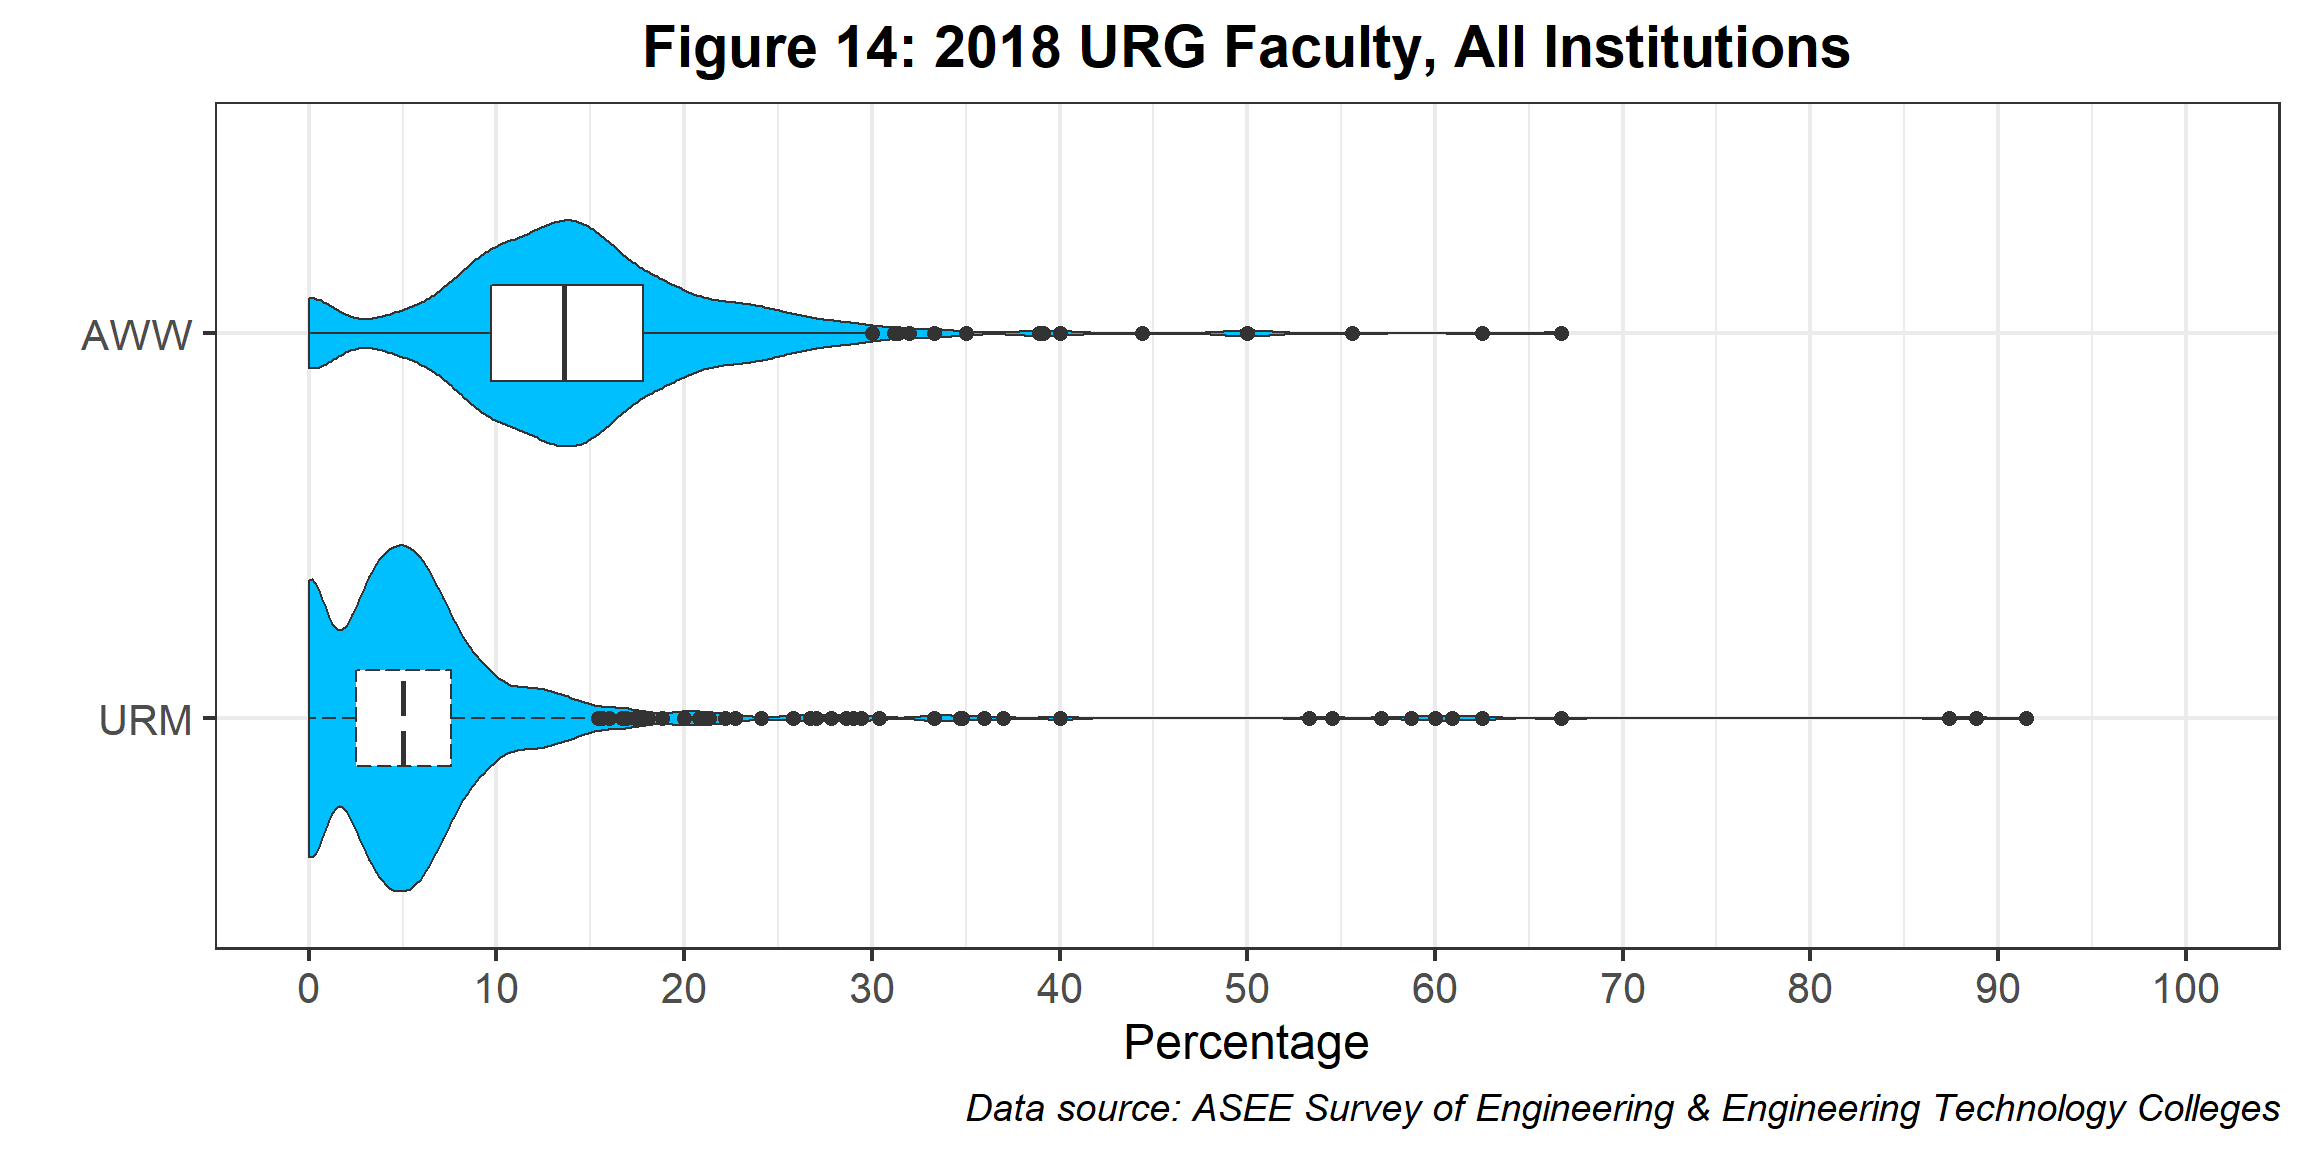
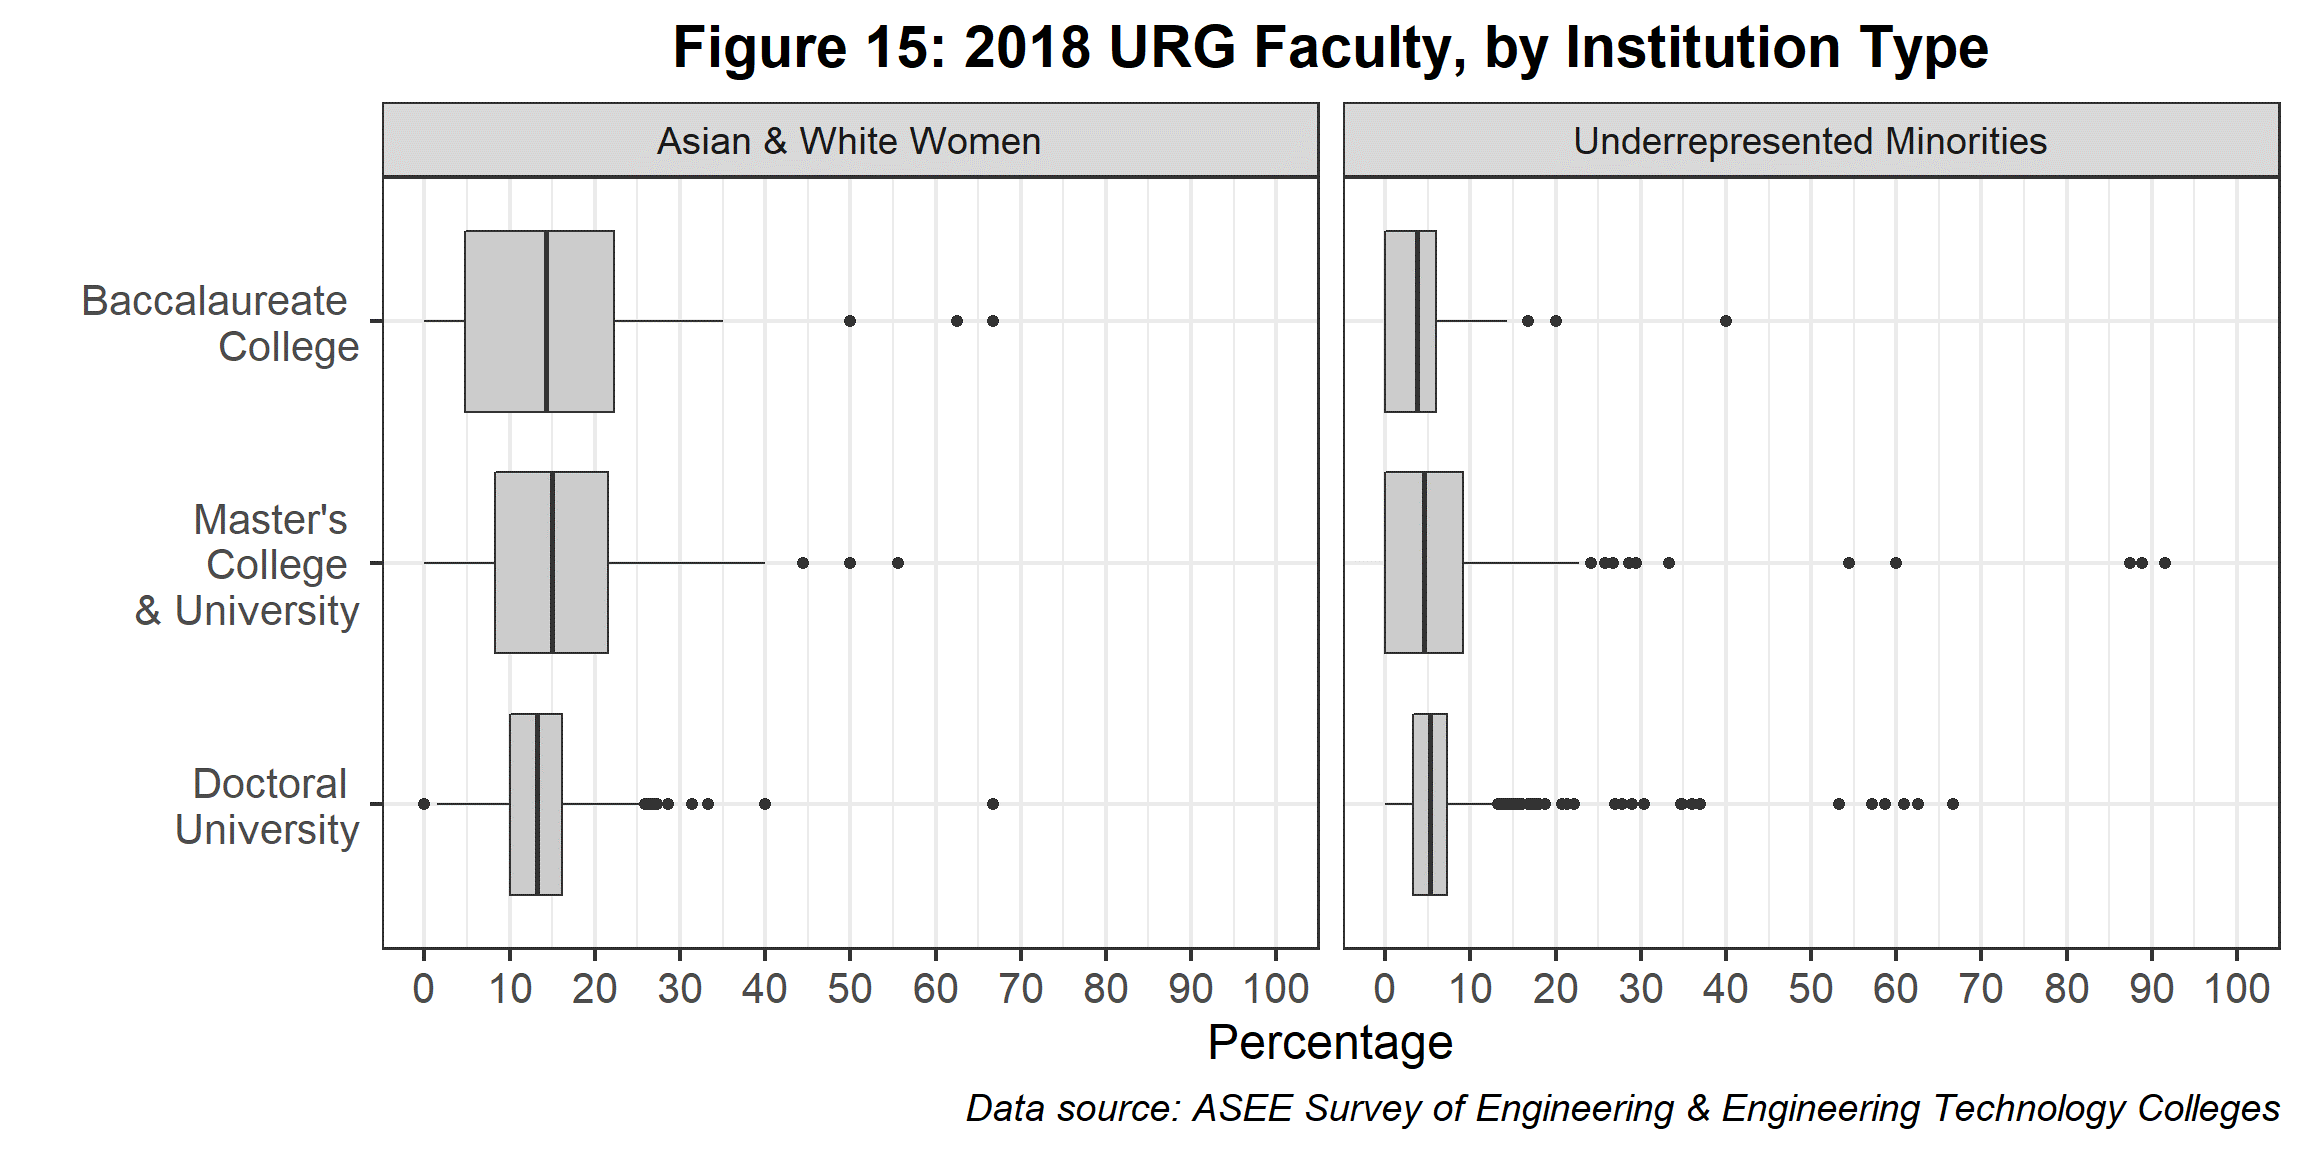
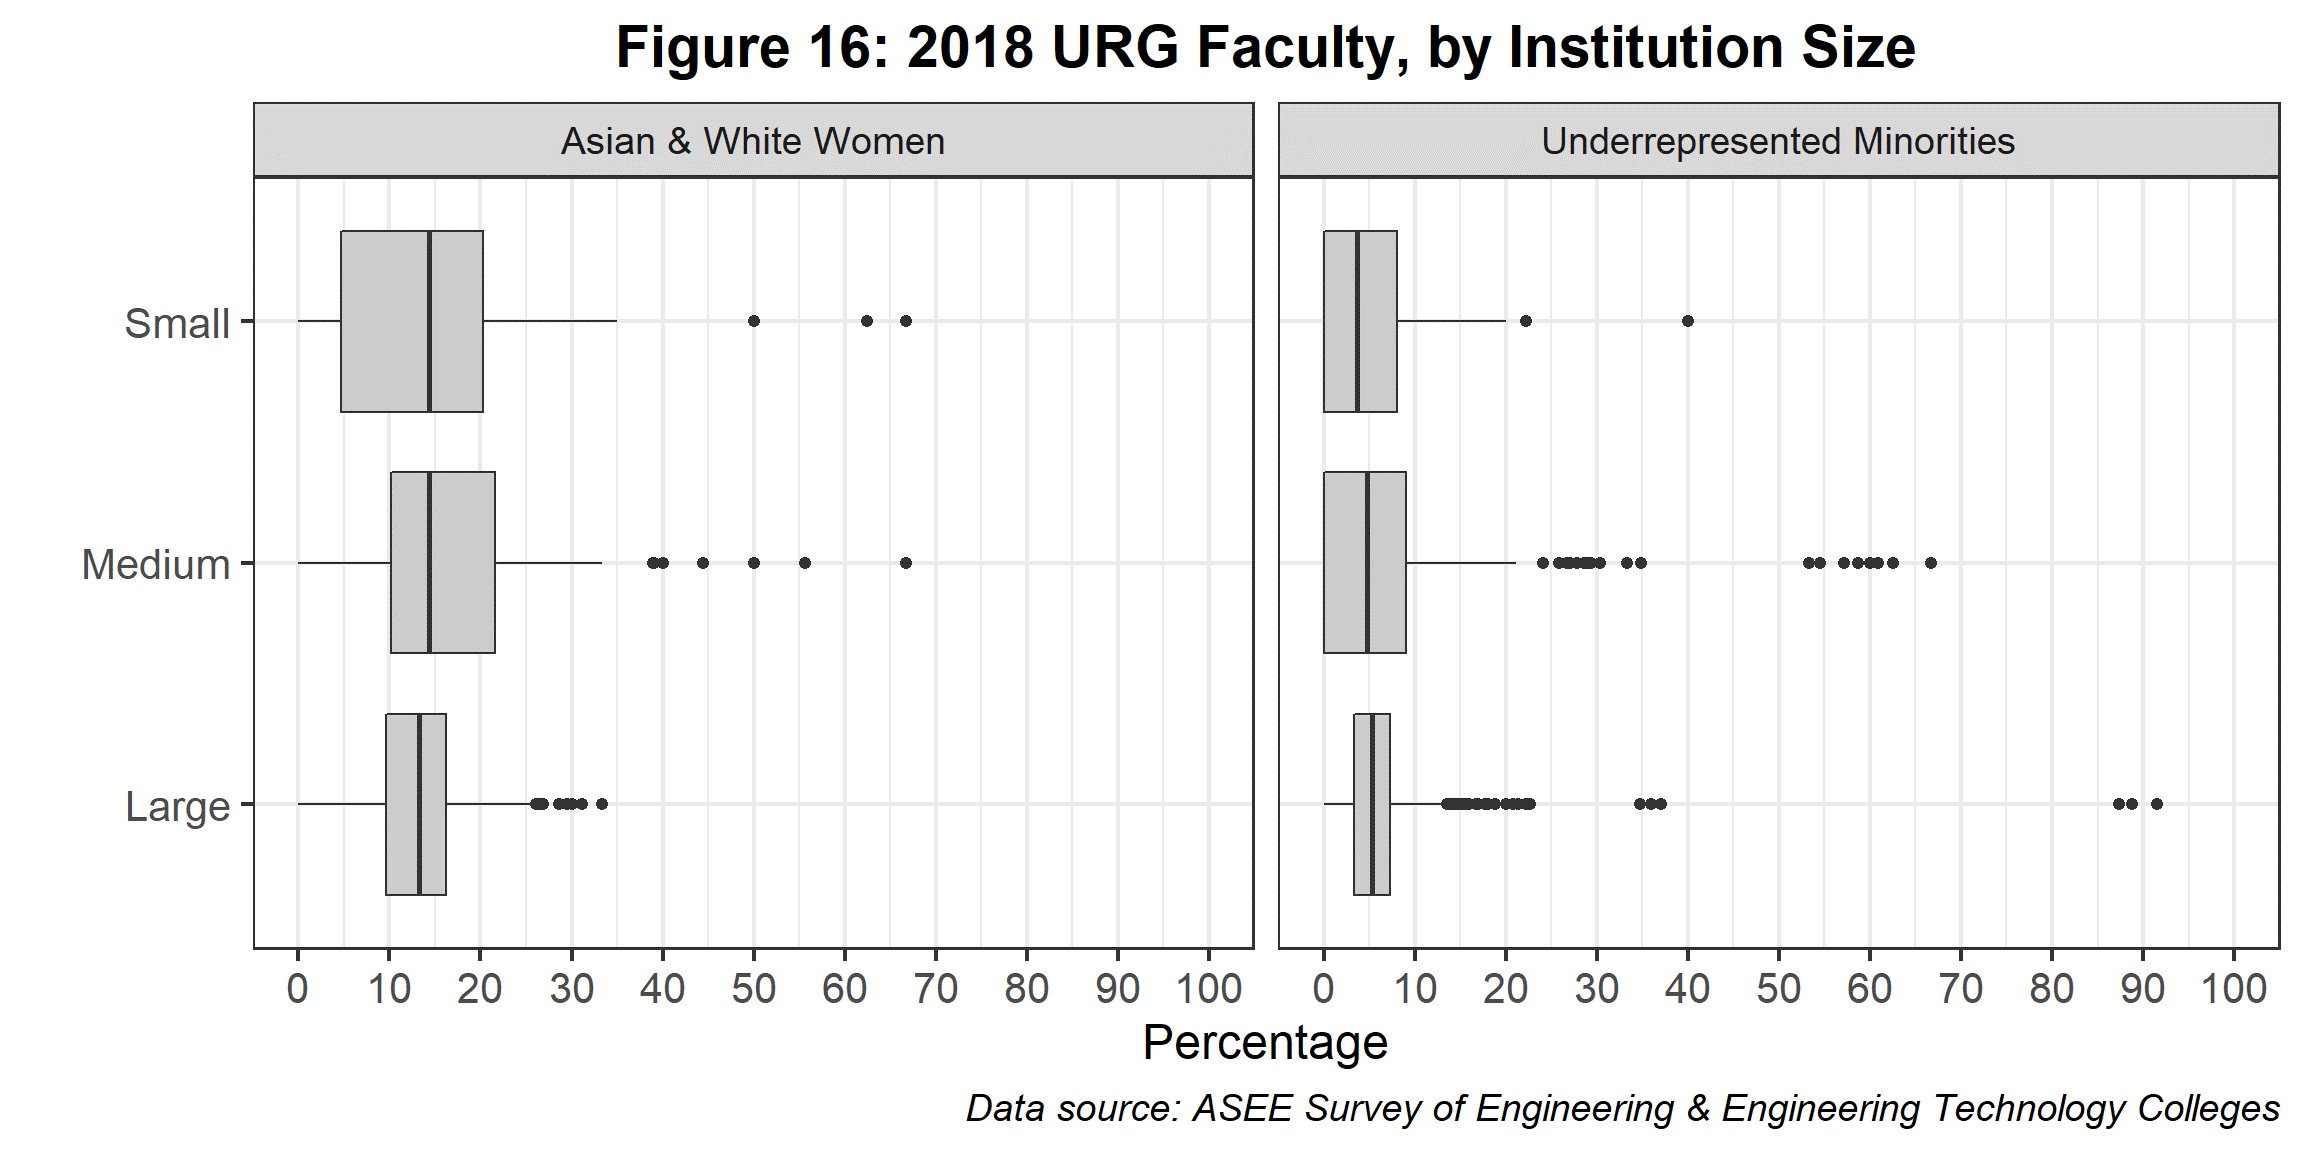
The median percentage of degrees awarded for all institutions in 2018 was 13.6 percent for AWW and 5.0 percent for URM (Figure 14). Figures 15-17 show the breakdown by institution type, size, and region.
Appendix of Supplemental Table Data
Percentage of URG Enrollment, All Institutions 2016-2018, Figure 3
| Year | Underrepresented Group | Total | URG Total | Percentage |
| 2016 | AWW | 609,498 | 88,065 | 14.4 |
| 2017 | AWW | 613,227 | 90,823 | 14.8 |
| 2018 | AWW | 613,555 | 92,941 | 15.1 |
| 2016 | URM | 609,498 | 102,260 | 16.8 |
| 2017 | URM | 613,227 | 105,873 | 17.3 |
| 2018 | URM | 613,555 | 110,152 | 18.0 |
2018 URG Enrollment, All Institutions, Figure 4
| AWW | URM | |
| Minimum | 0.0 | 0.0 |
| Lower Quartile | 9.1 | 8.3 |
| Median | 13.5 | 13.1 |
| Upper Quartile | 17.8 | 21.1 |
| Maximum | 30.0 | 40.1 |
2018 AWW Enrollment, by Institution Type, Figure 5
| Baccalaureate College | Master’s College & University | Doctoral University | |
| Minimum | 0.00 | 0.0 | 0.0 |
| Lower Quartile | 10.20 | 6.6 | 10.7 |
| Median | 14.05 | 9.8 | 15.0 |
| Upper Quartile | 21.40 | 13.4 | 19.1 |
| Maximum | 31.40 | 22.0 | 31.6 |
2018 URM Enrollment, by Institution Type, Figure 5
| Baccalaureate College | Master’s College & University | Doctoral University | |
| Minimum | 0.00 | 0.00 | 0.00 |
| Lower Quartile | 4.00 | 7.95 | 8.75 |
| Median | 8.55 | 13.25 | 13.65 |
| Upper Quartile | 12.30 | 26.45 | 20.60 |
| Maximum | 23.20 | 53.90 | 37.00 |
2018 AWW Enrollment, by Institution Size, Figure 6
| Small | Medium | Large | |
| Minimum | 0.00 | 0.0 | 0.0 |
| Lower Quartile | 8.90 | 8.0 | 10.0 |
| Median | 12.65 | 12.7 | 14.2 |
| Upper Quartile | 18.25 | 16.9 | 18.4 |
| Maximum | 31.40 | 26.7 | 29.1 |
2018 URM Enrollment, by Institution Size, Figure 6
| Small | Medium | Large | |
| Minimum | 0.00 | 0.0 | 0.0 |
| Lower Quartile | 6.20 | 8.4 | 8.6 |
| Median | 9.75 | 13.5 | 13.5 |
| Upper Quartile | 14.10 | 22.4 | 21.4 |
| Maximum | 25.10 | 35.9 | 40.5 |
2018 AWW Enrollment, by BEA Region, Figure 7
| Far West | Great Lakes | Mid East | New England | Plains | Rocky Mountains | Southeast | Southwest | |
| Minimum | 0.0 | 0.0 | 0.3 | 0.0 | 2.50 | 0.0 | 0.0 | 0.0 |
| Lower Quartile | 8.3 | 9.4 | 12.5 | 11.6 | 10.30 | 7.4 | 8.3 | 7.0 |
| Median | 12.0 | 13.1 | 16.7 | 17.6 | 12.75 | 13.5 | 12.8 | 9.9 |
| Upper Quartile | 16.2 | 16.3 | 20.8 | 21.4 | 16.65 | 15.1 | 17.3 | 15.0 |
| Maximum | 26.5 | 25.3 | 29.1 | 32.2 | 21.40 | 23.6 | 24.9 | 25.0 |
2018 URM Enrollment, by BEA Region, Figure 7
| Far West | Great Lakes | Mid East | New England | Plains | Rocky Mountains | Southeast | Southwest | |
| Minimum | 0.0 | 0.0 | 0.0 | 0.0 | 0.00 | 0.0 | 0.0 | 2.2 |
| Lower Quartile | 14.0 | 5.1 | 8.3 | 7.3 | 5.60 | 5.0 | 10.4 | 16.1 |
| Median | 20.7 | 8.0 | 12.7 | 11.9 | 7.50 | 9.5 | 14.8 | 23.8 |
| Upper Quartile | 31.8 | 11.2 | 18.0 | 16.7 | 9.45 | 13.3 | 26.0 | 48.9 |
| Maximum | 52.3 | 19.6 | 29.6 | 23.8 | 14.10 | 20.7 | 42.7 | 87.3 |
Percentage of URG Degrees, All Institutions 2016-2018, Figure 8
| Year | Underrepresented Group | Total | URG Total | Percentage |
| 2016 | AWW | 113,735 | 16,101 | 14.2 |
| 2017 | AWW | 122,778 | 17,916 | 14.6 |
| 2018 | AWW | 129,984 | 19,279 | 14.8 |
| 2016 | URM | 113,735 | 15,821 | 13.9 |
| 2017 | URM | 122,778 | 17,200 | 14.0 |
| 2018 | URM | 129,984 | 18,607 | 14.3 |
2018 URG Degrees, All Institutions, Figure 9
| AWW | URM | |
| Minimum | 0.00 | 0.00 |
| Lower Quartile | 9.10 | 6.00 |
| Median | 13.15 | 10.40 |
| Upper Quartile | 17.40 | 17.55 |
| Maximum | 29.40 | 34.70 |
2018 AWW Degrees, by Institution Type, Figure 10
| Baccalaureate College | Master’s College & University | Doctoral University | |
| Minimum | 0.0 | 0.00 | 0.00 |
| Lower Quartile | 7.3 | 5.15 | 10.50 |
| Median | 13.6 | 9.80 | 13.95 |
| Upper Quartile | 18.8 | 14.65 | 18.30 |
| Maximum | 35.0 | 28.70 | 28.80 |
2018 URM Degrees, by Institution Type, Figure 10
| Baccalaureate College | Master’s College & University | Doctoral University | |
| Minimum | 0.0 | 0.00 | 0.0 |
| Lower Quartile | 2.9 | 4.85 | 6.6 |
| Median | 6.1 | 10.70 | 10.7 |
| Upper Quartile | 10.6 | 24.60 | 17.3 |
| Maximum | 19.3 | 52.90 | 33.2 |
2018 AWW Degrees, by Institution Size, Figure 11
| Small | Medium | Large | |
| Minimum | 0.00 | 0.0 | 0.0 |
| Lower Quartile | 6.70 | 7.0 | 9.5 |
| Median | 12.40 | 12.4 | 13.6 |
| Upper Quartile | 17.45 | 18.5 | 17.2 |
| Maximum | 32.00 | 33.5 | 27.5 |
2018 URM Degrees, by Institution Size, Figure 11
| Small | Medium | Large | |
| Minimum | 0.00 | 0.0 | 0.0 |
| Lower Quartile | 2.90 | 6.1 | 6.4 |
| Median | 7.35 | 10.7 | 10.7 |
| Upper Quartile | 13.25 | 19.0 | 17.9 |
| Maximum | 28.00 | 37.5 | 34.7 |
2018 AWW Degrees, by BEA Region, Figure 12
| Far West | Great Lakes | Mid East | New England | Plains | Rocky Mountains | Southeast | Southwest | |
| Minimum | 0.00 | 0.00 | 0.00 | 0.0 | 6.80 | 0.0 | 0.00 | 0.0 |
| Lower Quartile | 8.50 | 9.15 | 10.75 | 12.0 | 11.70 | 7.8 | 7.95 | 6.8 |
| Median | 11.75 | 12.55 | 15.55 | 16.2 | 13.75 | 11.2 | 13.50 | 11.1 |
| Upper Quartile | 16.00 | 16.30 | 20.15 | 21.2 | 16.75 | 16.7 | 16.95 | 15.4 |
| Maximum | 25.20 | 25.70 | 32.40 | 33.8 | 23.10 | 23.0 | 25.50 | 27.5 |
2018 URM Degrees, by BEA Region, Figure 12
| Far West | Great Lakes | Mid East | New England | Plains | Rocky Mountains | Southeast | Southwest | |
| Minimum | 0.00 | 0.00 | 0.00 | 0.0 | 0.00 | 0.0 | 0.0 | 0.0 |
| Lower Quartile | 10.30 | 3.65 | 6.70 | 5.0 | 4.45 | 3.3 | 7.6 | 14.9 |
| Median | 16.25 | 5.80 | 10.40 | 9.4 | 6.40 | 6.6 | 11.7 | 20.3 |
| Upper Quartile | 25.20 | 8.55 | 15.15 | 14.4 | 8.20 | 9.6 | 23.5 | 33.9 |
| Maximum | 47.50 | 15.10 | 25.70 | 21.9 | 13.00 | 18.0 | 39.0 | 60.4 |
Percentage of URG Faculty, All Institutions 2016-2018, Figure 13
| Year | Underrepresented Group | Total | URG Total | Percentage |
| 2016 | AWW | 27,263 | 3,587 | 13.2 |
| 2017 | AWW | 26,902 | 3,696 | 13.7 |
| 2018 | AWW | 26,823 | 3,815 | 14.2 |
| 2016 | URM | 27,263 | 1,758 | 6.4 |
| 2017 | URM | 26,902 | 1,724 | 6.4 |
| 2018 | URM | 26,823 | 1,747 | 6.5 |
2018 URG Faculty, All Institutions, Figure 14
| AWW | URM | |
| Minimum | 0.0 | 0.0 |
| Lower Quartile | 9.7 | 2.5 |
| Median | 13.6 | 5.0 |
| Upper Quartile | 17.8 | 7.6 |
| Maximum | 29.8 | 15.1 |
2018 AWW Faculty, by Institution Type, Figure 15
| Baccalaureate College | Master’s College & University | Doctoral University | |
| Minimum | 0.0 | 0.0 | 1.50 |
| Lower Quartile | 4.6 | 8.3 | 10.00 |
| Median | 14.3 | 15.0 | 13.25 |
| Upper Quartile | 22.2 | 21.5 | 16.20 |
| Maximum | 35.0 | 40.0 | 25.50 |
2018 URM Faculty, by Institution Type, Figure 15
| Baccalaureate College | Master’s College & University | Doctoral University | |
| Minimum | 0.00 | 0.0 | 0.0 |
| Lower Quartile | 0.00 | 0.0 | 3.3 |
| Median | 3.75 | 4.5 | 5.2 |
| Upper Quartile | 5.90 | 9.1 | 7.2 |
| Maximum | 14.30 | 22.7 | 13.0 |
2018 AWW Faculty, by Institution Size, Figure 16
| Small | Medium | Large | |
| Minimum | 0.00 | 0.0 | 0.0 |
| Lower Quartile | 4.65 | 10.2 | 9.6 |
| Median | 14.30 | 14.3 | 13.2 |
| Upper Quartile | 20.25 | 21.7 | 16.2 |
| Maximum | 35.00 | 38.9 | 25.5 |
2018 URM Faculty, by Institution Size, Figure 16
| Small | Medium | Large | |
| Minimum | 0.0 | 0.0 | 0.0 |
| Lower Quartile | 0.0 | 0.0 | 3.3 |
| Median | 3.7 | 4.8 | 5.3 |
| Upper Quartile | 8.0 | 9.1 | 7.3 |
| Maximum | 20.0 | 21.1 | 13.3 |
2018 AWW Faculty, by BEA Region, Figure 17
| Far West | Great Lakes | Mid East | New England | Plains | Rocky Mountains | Southeast | Southwest | |
| Minimum | 0.00 | 0.0 | 4.00 | 0.00 | 8.1 | 0.0 | 0.00 | 0.00 |
| Lower Quartile | 8.30 | 10.0 | 13.35 | 12.30 | 11.9 | 7.7 | 8.55 | 7.85 |
| Median | 14.25 | 13.6 | 16.20 | 16.00 | 13.8 | 10.9 | 12.00 | 10.40 |
| Upper Quartile | 20.85 | 17.1 | 20.75 | 21.25 | 18.0 | 18.6 | 14.55 | 13.50 |
| Maximum | 39.10 | 25.0 | 30.00 | 29.40 | 26.9 | 33.3 | 23.10 | 19.80 |
2018 URM Faculty, by BEA Region, Figure 17
| Far West | Great Lakes | Mid East | New England | Plains | Rocky Mountains | Southeast | Southwest | |
| Minimum | 0.00 | 0.0 | 0.00 | 0.00 | 0.0 | 0.0 | 0.00 | 0.0 |
| Lower Quartile | 2.30 | 0.7 | 2.60 | 0.00 | 0.8 | 1.2 | 4.20 | 4.5 |
| Median | 4.45 | 4.2 | 4.80 | 4.45 | 3.8 | 2.7 | 6.20 | 6.8 |
| Upper Quartile | 8.60 | 6.3 | 7.65 | 6.45 | 5.6 | 5.1 | 9.15 | 12.4 |
| Maximum | 17.40 | 13.3 | 14.40 | 14.30 | 7.7 | 9.5 | 15.60 | 22.2 |
Count by Institution Type
| Type | (n) |
| Baccalaureate College | 25 |
| Doctoral University | 200 |
| Master’s College & University | 71 |
Count by Institution Size
| Size | (n) |
| Large | 180 |
| Medium | 88 |
| Small | 28 |
Count by Region
| Region | (n) |
| Far West Region | 48 |
| Great Lakes Region | 49 |
| Mid East Region | 53 |
| New England Region | 27 |
| Plains Region | 17 |
| Rocky Mountains Region | 16 |
| Southeast Region | 60 |
| Southwest Region | 26 |
Download the Report
PDF: Diversity Benchmarking Report for Underrepresented Groups in Engineering